Clean Air in London used powerful European access to environmental information laws to obtain 1.5 million pieces of data from the Mayor of London. Thousands of pages published
Top three worst roads in 2012 were A406 (North Circular), A282 (Dartford Crossing) and A13 (Commercial Road). Shoppers are being gassed in Oxford Street by Transport for London buses and showered in deadly particles in Brompton Road by taxis, diesel light goods vehicles and cars. Many suburban roads among the worst e.g. Reigate Hill and Twickenham Road
Diesel vehicles responsible for up to 30 times more nitrogen dioxide (NO2) and particle exhaust emissions (PM2.5) than petrol vehicles. Petrol cars and motorcycles most responsible for benzene. Air pollution has not fallen as the Mayor’s computer modelling predicted. Annual average levels of NO2 in Oxford Street and Brompton Road well over twice legal limits
Free Clean Air in Cities IndexTM App reporting the health impact of long-term exposure to air pollution (PM2.5) on the population in local areas, regions and England as a whole can be downloaded at http://itun.es/i6xj69k
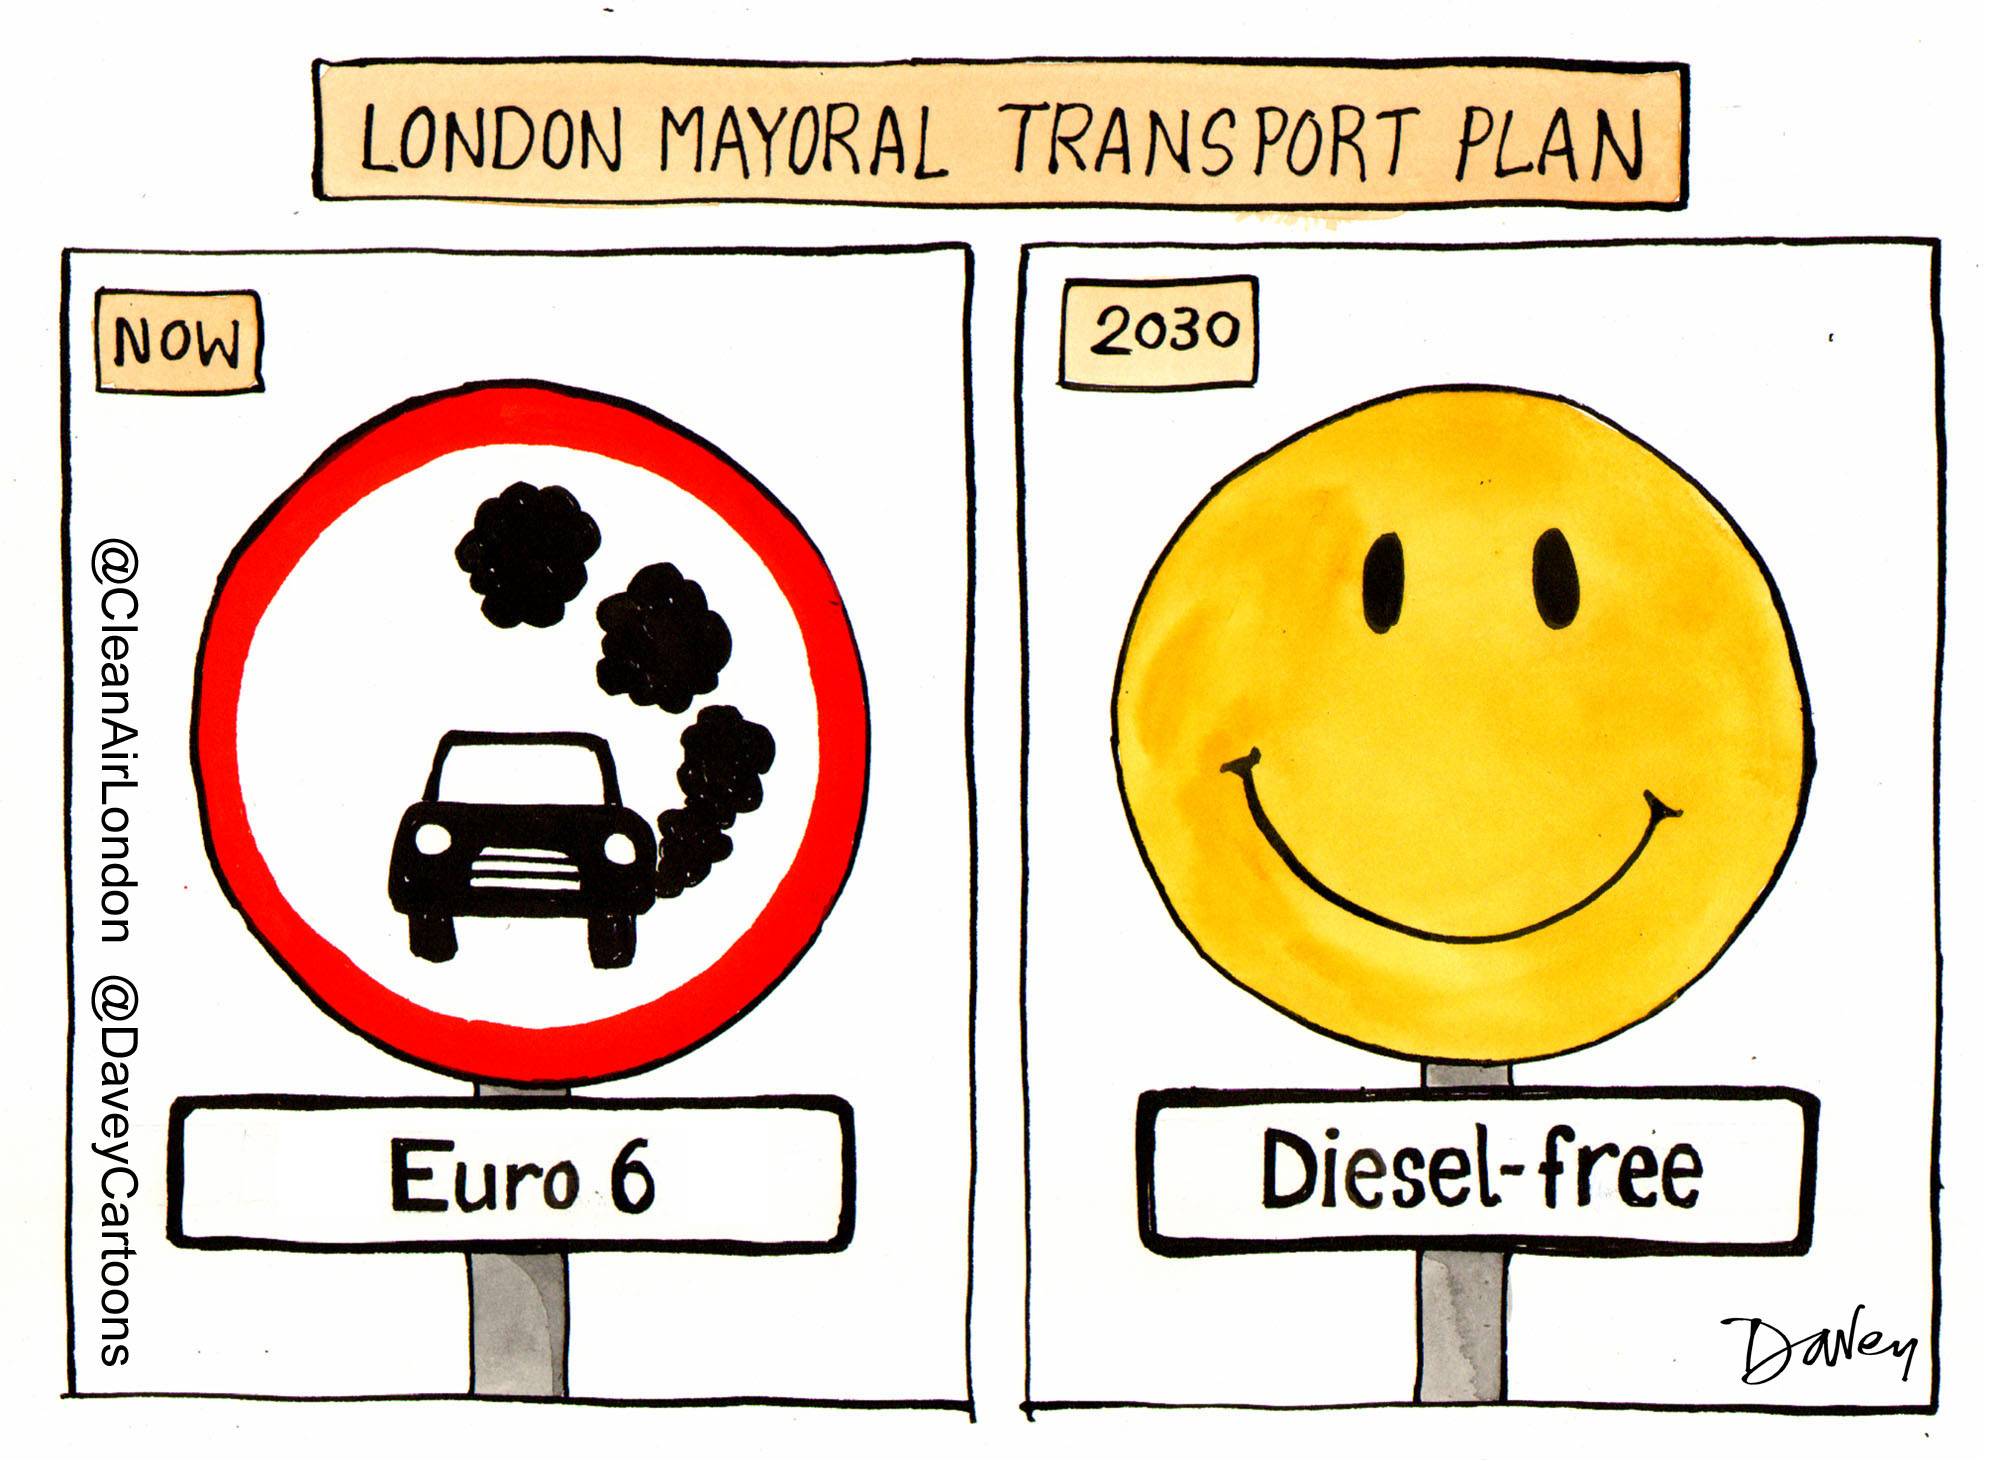
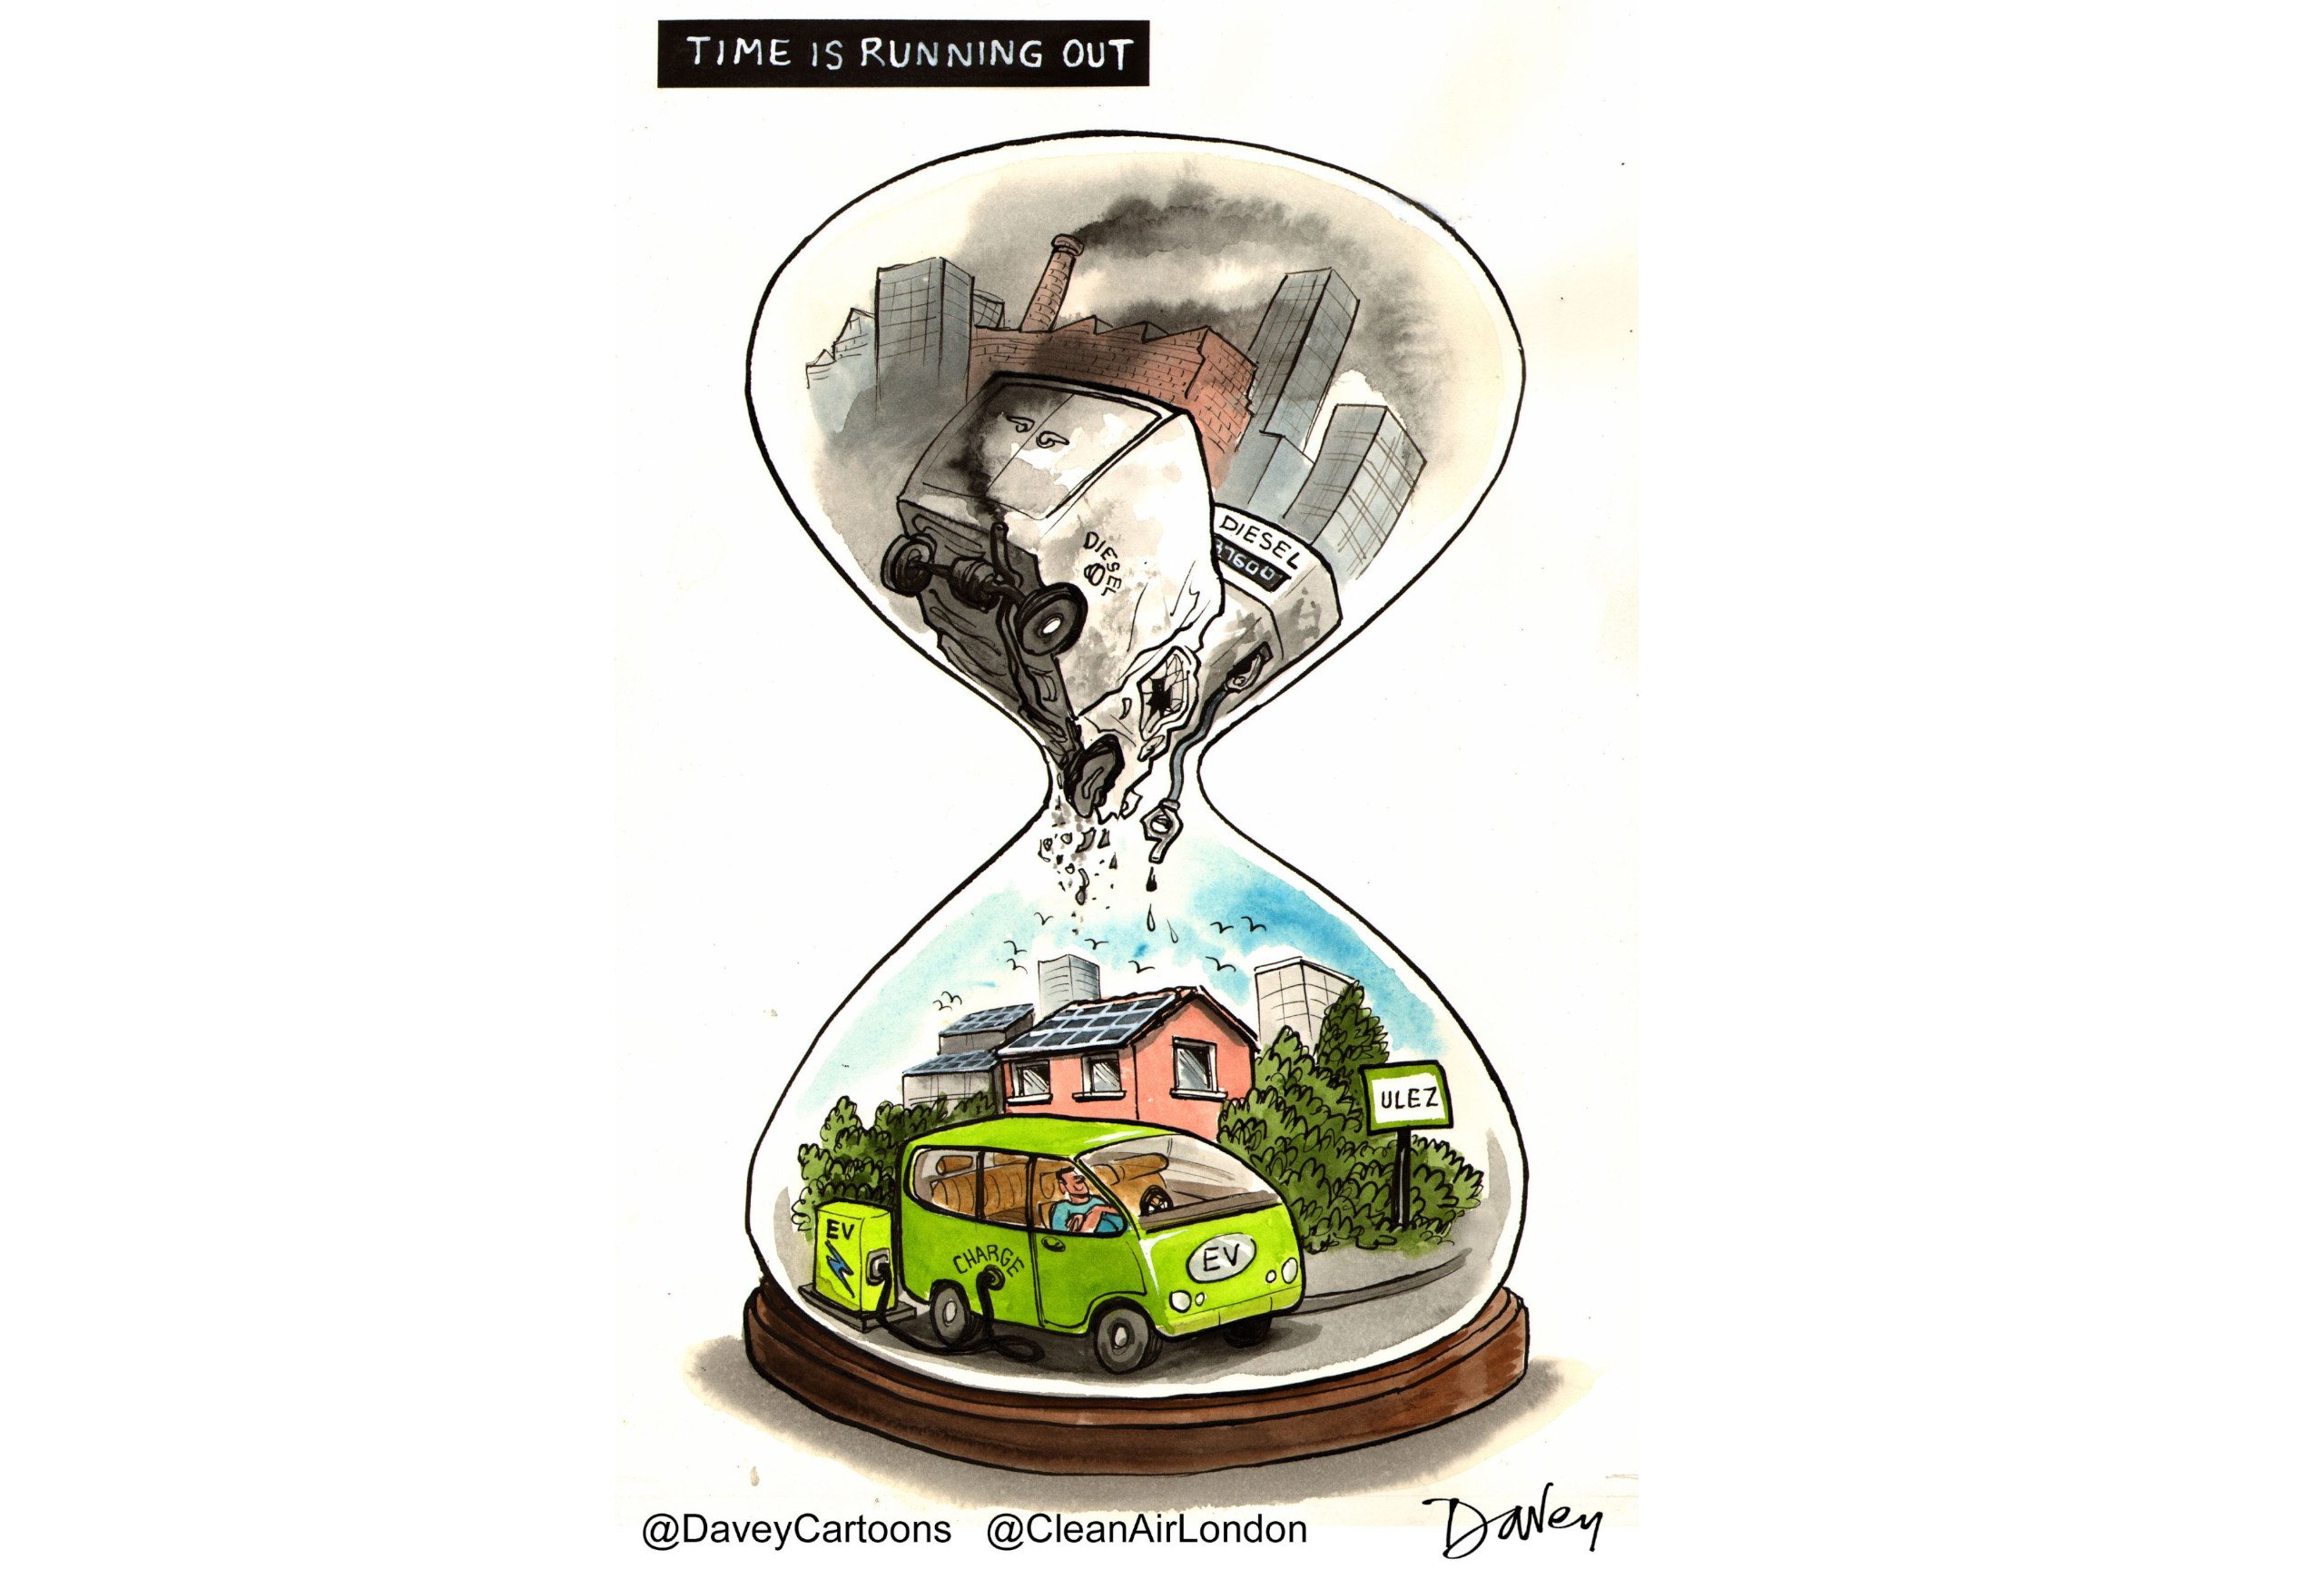
Clean Air in London calls for the banning of all diesel vehicles from the most polluted parts of London by 2020
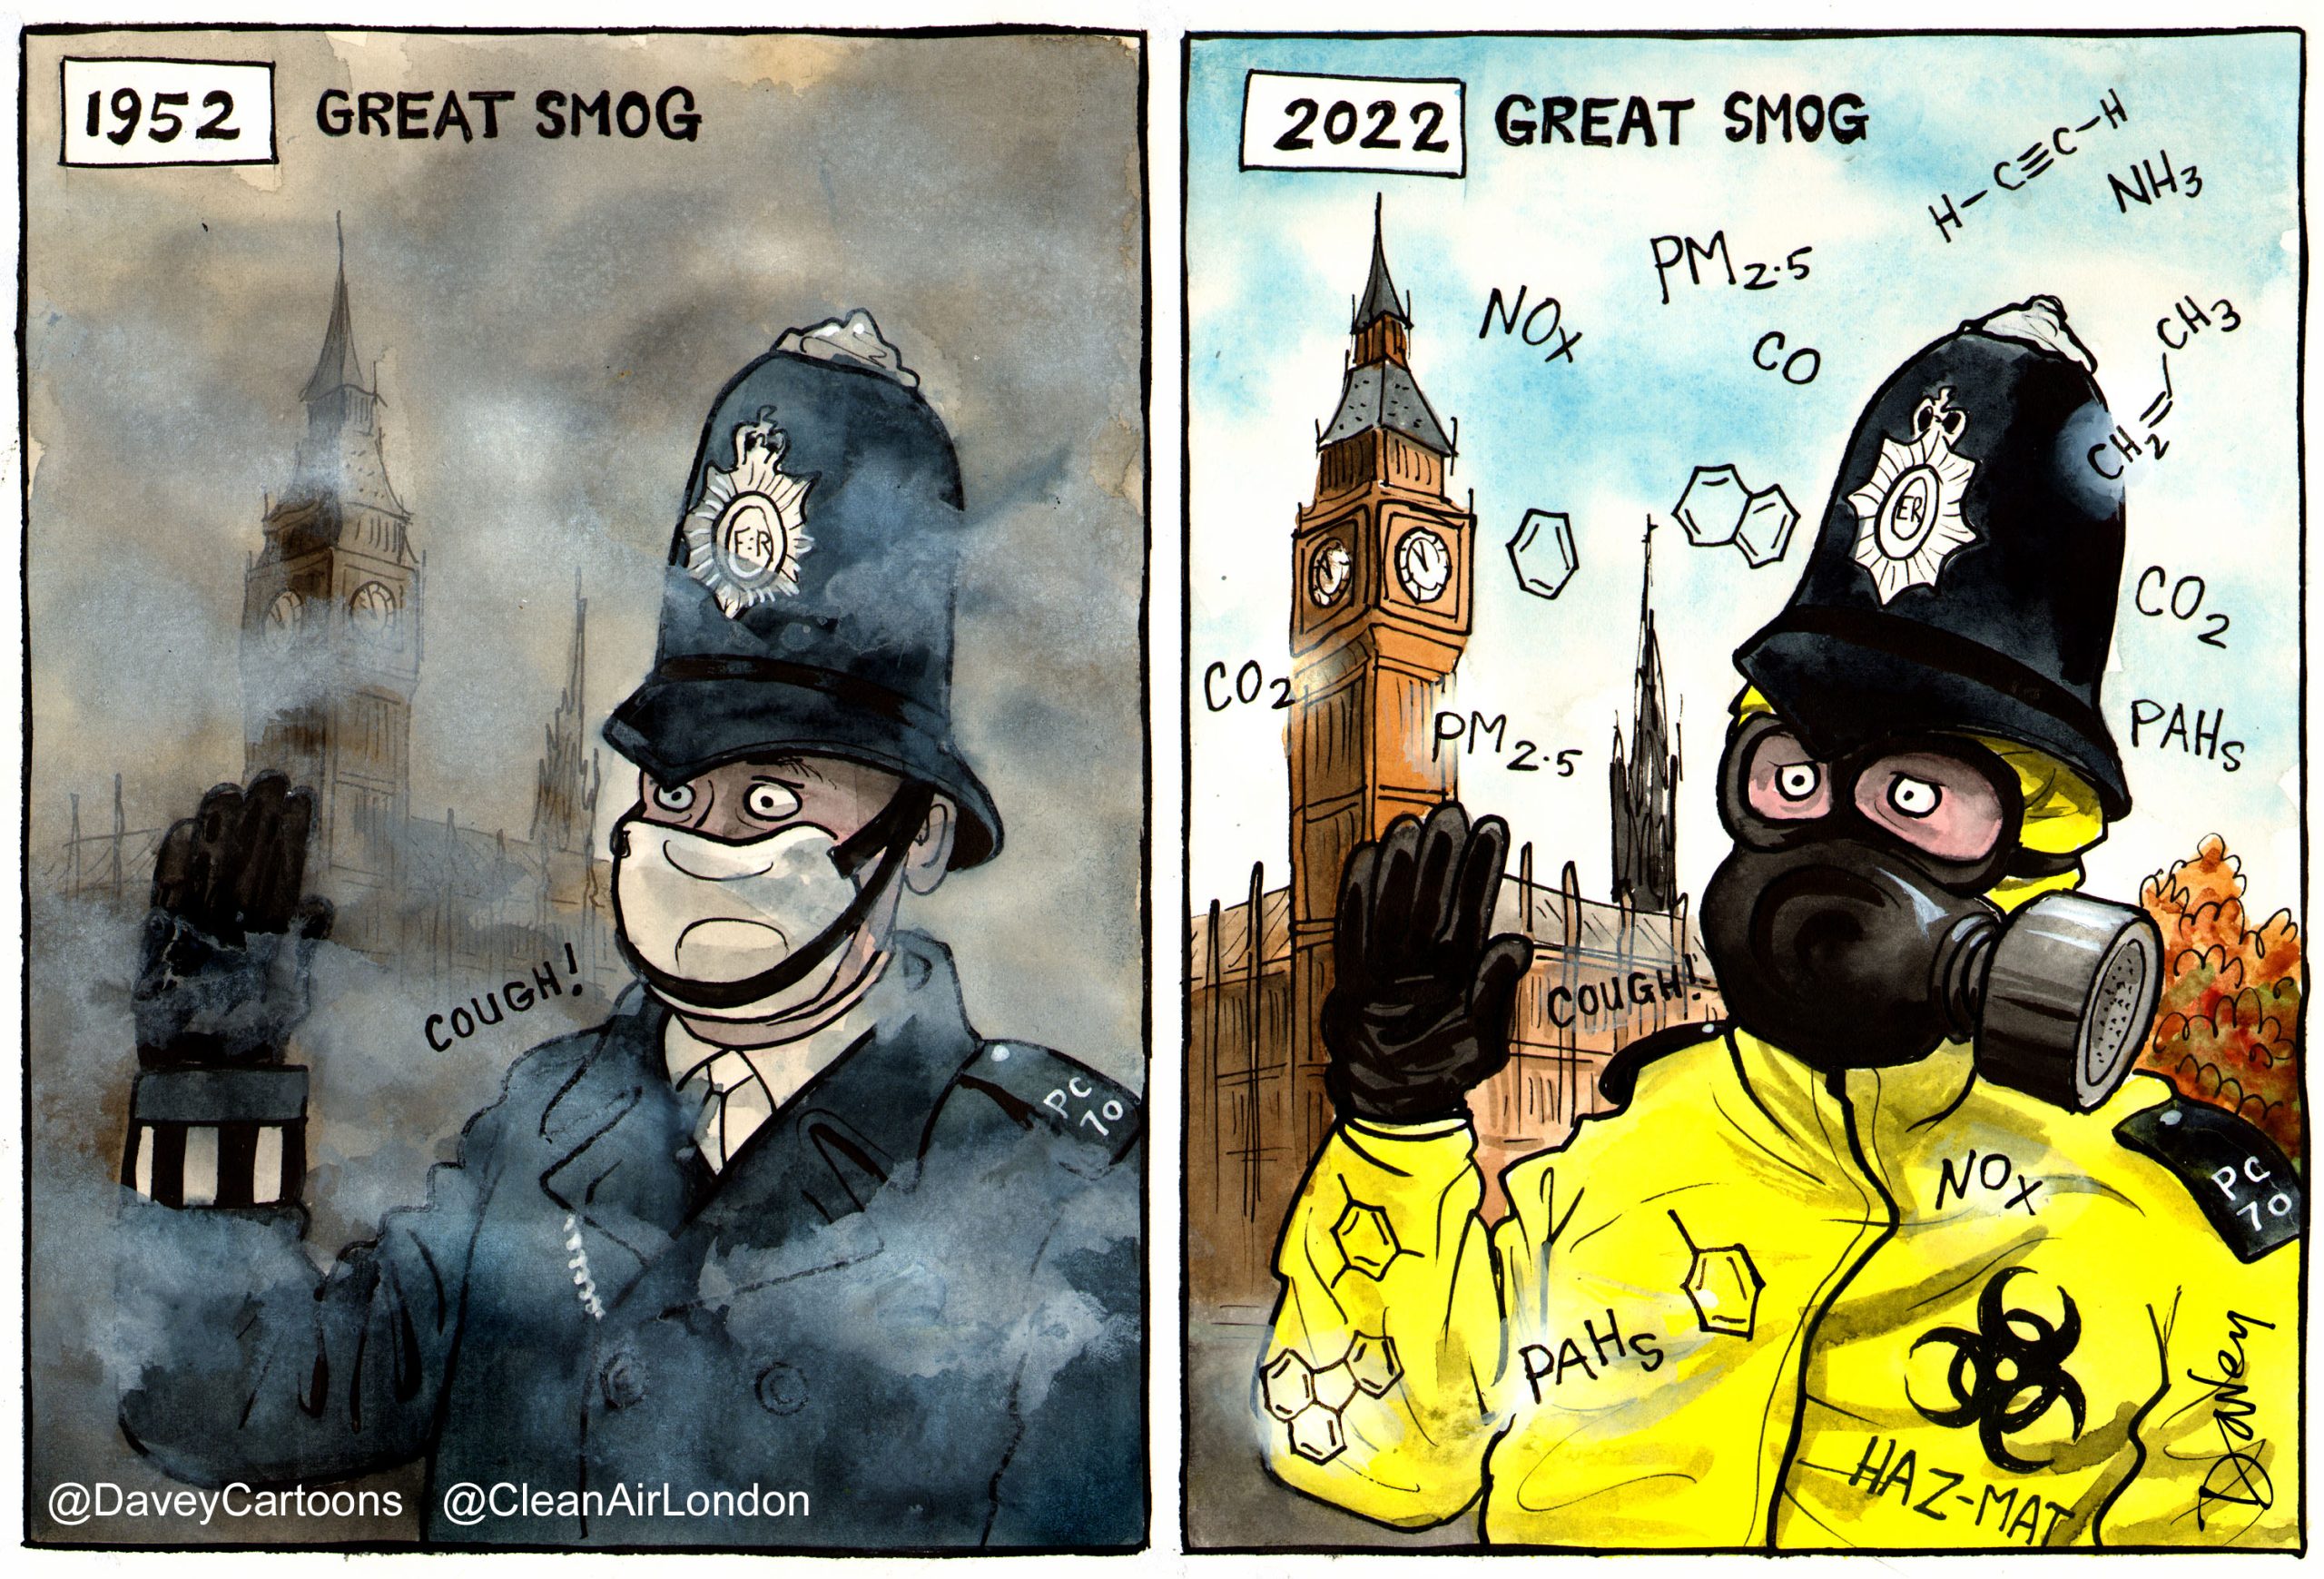
The Mayor of London has released details of diesel exhaust for every significant road link in London after a formal request from Clean Air in London (CAL) using powerful European access to environmental information laws. The World Health Organisation (WHO) classified diesel exhaust as carcinogenic for humans in June 2012 Note 2.
The information discloses for the first time emissions of 12 regulated pollutants from each category of road transport, in tonnes and tonnes per kilometre, in each of 2008, 2010 and 2012. Over 1.5 million pieces of computer modelling data have been released including:
- Pollutants: benzene, butadiene, methane (CH4), carbon monoxide (CO), carbon dioxide (CO2), non-methane volatile organic compounds (NMVOC), nitrogen dioxide (NO2), oxides of nitrogen (NOx), polycyclic hydrocarbons (PaH), dangerous airborne particles (PM10 and PM2.5), sulphur dioxide (SO2);
- Vehicle categories: motorcycles, taxis, cars (petrol and diesel), light goods vehicles (petrol and diesel), London Transport bus, coaches and heavy goods vehicles (rigid and articulated); and
- Roads: 41,713 sections of road in London up to and including the M25. These have been released together with Transport for London’s road classification for them.
The information has been provided in an Access database file with separate summaries for emissions of NOx and PM10 for each category of road transport in 2010. CAL is publishing thousands of pages of this information for benzene, NO2, NOx, PM2.5 and PM10 in 2012 with a ranking of the worst roads.
Interactive maps
How polluted is my road? New website from Jenny Jones AM, Green Group, London Assembly
http://www.howpollutedismyroad.org.uk/roads.php
Key initial findings, excluding motorways, include:
1. Top five worst roads in London in terms of emission rates (i.e. tonnes per kilometres per year) for the different air pollutants in London in 2012 in descending order were:
- Benzene: A406 (North Circular Road), A118, A1055, A40 and A282
- NO2: A406, A118, A1055, Alfred’s Way in East Ham and Barking (A13) and A13
- NOx: A282 (Dartford Crossing), A406, A118, Alfred’s Way (A13) and A40 (Oxford Street)
- PM2.5:A406, A1055, A40, A118 and A4202 (Park Lane)
- PM10: A406, A1055, A40, A118 and A4202 (Park Lane)
2. Top five worst roads in London in terms of total tonnes emitted for the different air pollutants in London in 2012 in descending order were:
- NO2: A13 (Commercial Road), A282, A3, A40 and A406
- PM2.5: A13, A3, A40, A406 and A282
3. Marylebone Road, which the Government claims is the most polluted place in London, appears nowhere in CAL’s ranking of the top 20 worst roads;
4. Oxford Street and Brompton Road, two of the busiest for shoppers, were in the top 15 worst locations in London in 2012 for emissions of NO2 (9.0 tonnes per kilometre per year ) and PM2.5 (0.8 tonnes per kilometre per year) respectively;
5. coaches and London Transport buses are estimated to have emitted a staggering 1.3 tonnes and 6.4 tonnes of NO2 per kilometre per year respectively at the worst place in Oxford Street in 2012. The main sources of PM2.5 in Brompton Road were taxis, diesel light goods vehicles and diesel cars at 500, 112 and 85 kilograms per kilometre per year respectively in 2012;
6. Oxford Street and Brompton Road appear also in the top 20 worst roads for emissions of benzene at 24 and 25 kilograms per kilometre per year respectively in 2012;
7. diesel vehicles produce the vast majority of NO2, NOx, PM2.5 and PM10 of exhaust emissions in total tonnes per kilometre per year at 98%, 96%, 94% and 94% respectively on the worst road link for each pollutant i.e. 20 to 30 times more than petrol vehicles. Conversely, petrol cars and motorcycles produce some 79% of the total tonnes per kilometre per year for benzene emissions (64% and 15% respectively on the worst road link) i.e. four times more than diesel vehicles; and
8. those living near busy roads, often the poorest people, will be most exposed to the most harmful air pollutants.
Air pollution has not fallen as predicted by the Mayor’s computer modelling. Annual average levels of NO2 in Oxford Street and Brompton Road are well over twice legal limits in legislation since 1999 to be complied with by 1 January 2010 Note 8. London has the highest levels of NO2 of any capital city in Europe Note 6.
CAL has passed the information released by the Mayor to the Conservative, Green, Labour and Liberal Democrat parties in the London Assembly to aid their scrutiny of the Mayor of London’s efforts to reduce air pollution in London.
Quotes
Simon Birkett, Founder and Director of Clean Air in London, said:
“In environmental terms, this is like discovering the Rosetta Stone. All of a sudden Londoners can decode air pollution on their doorstep – in a nutshell, it’s the ‘who’, ‘what’, ‘where’ and ‘when’ of air pollution in London. Clean Air in London applauds the Mayor for releasing this information.
“Health guidelines and legal limits are set in terms of billionths of a kilogram whereas this data reveals emissions in tonnes or hundreds of kilograms per kilometre per year. It is particularly valuable to see the sources of nitrogen dioxide (NO2) emissions which are rarely disclosed despite it being one of the two most important air pollutants for public health and legal compliance. It will take months to analyse the data fully.
“Every politician, campaigner, resident, worker and business in London can now see summary information for the most dangerous forms of air pollution. Clean Air in London is also launching its free Clean Air in Cities IndexTM (or Birkett IndexTM) App which reports the health impact of long-term exposure to air pollution (PM2.5) on the population in local areas, regions and England as a whole Note 10. The App can be downloaded at http://itun.es/i6xj69k. Clean Air in London urges the Mayor to update the data used by the App annually and the diesel exhaust data every two years.
“Clean Air in London hopes campaigners, local authorities and others will challenge the Mayor where claimed emission reductions, based on computer modelling, have not been reflected in reductions in concentrations of regulated air pollutants reported by monitoring equipment. People can request further information from the Mayor or Transport for London using powerful European access to environmental information laws.
“People can protect themselves by walking down less polluted roads and reduce pollution for themselves and others by walking or cycling or using public transport rather than driving a diesel car. For indoor air quality, people can ask if buildings with mechanical ventilation use regularly maintained air filters that comply with British and European standard EN 13779.
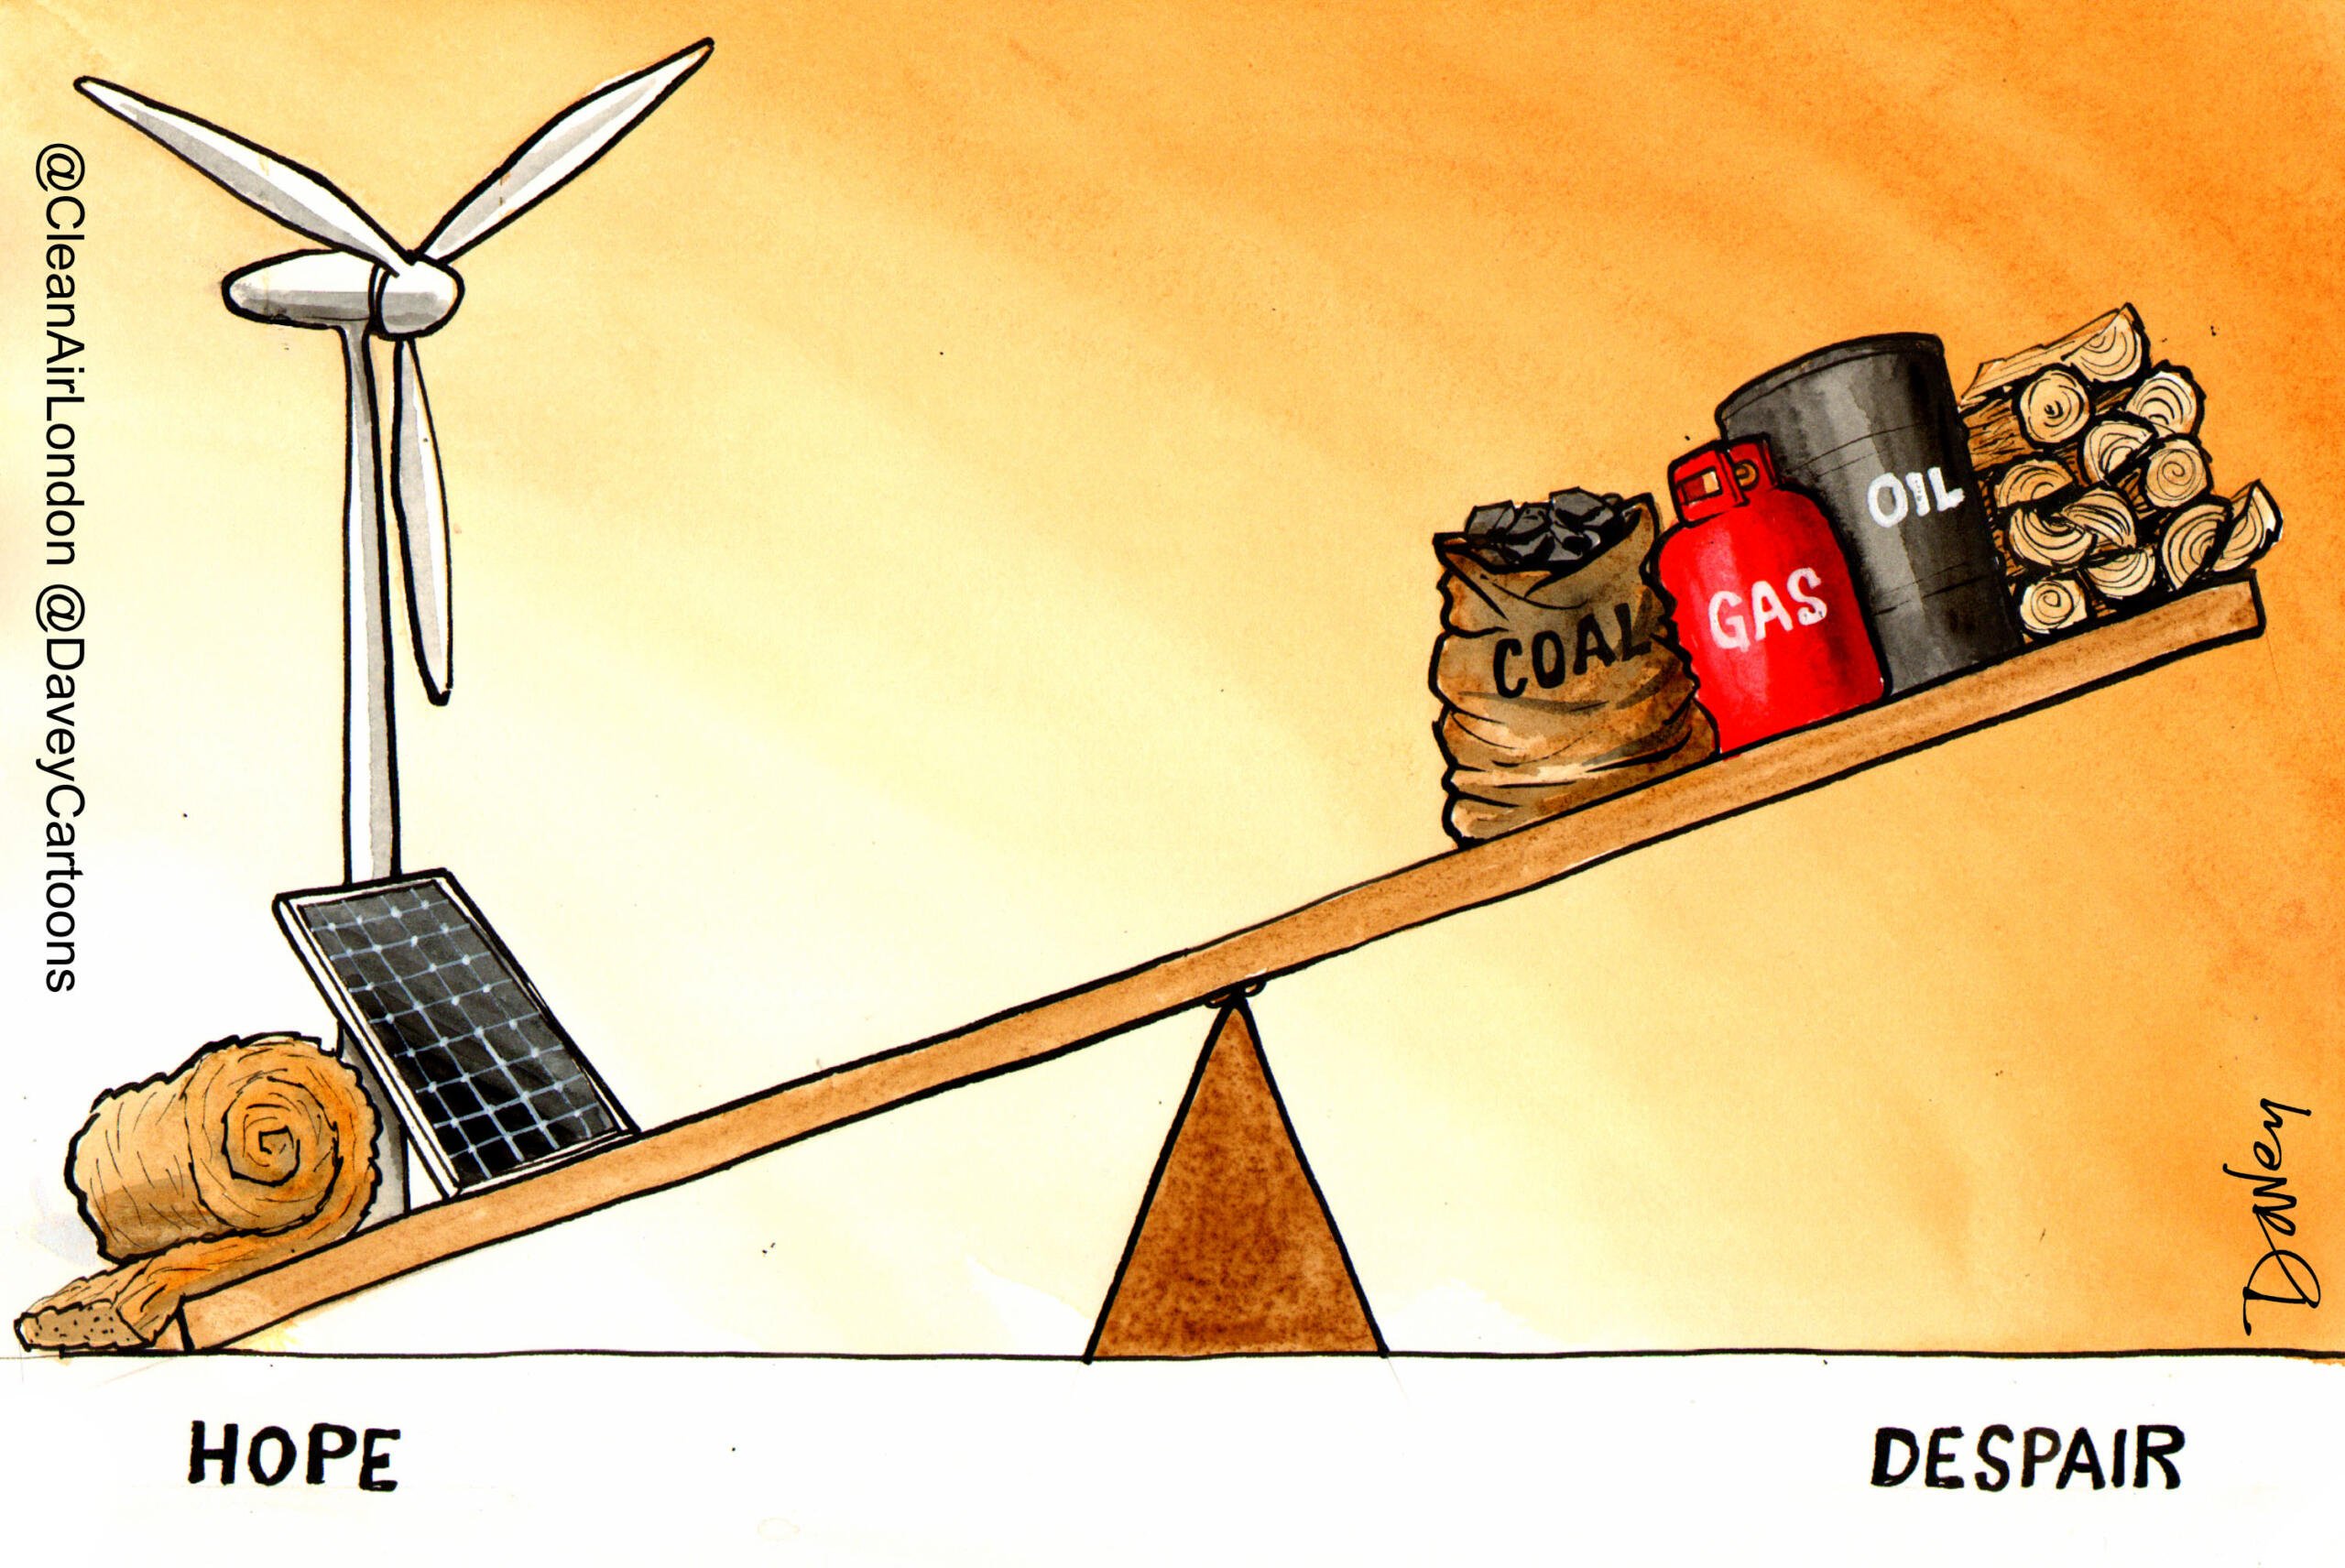
“Ultimately, the only answer is for London to eliminate completely deadly diesel exhaust from the most polluted parts of London by 2020. By doing so, London can lead the way in Europe and elsewhere in innovation and creating a successful, truly balanced economy.
“Last but not least, Clean Air in London records its thanks to Gerry Facenna, a leading barrister at Monckton Chambers, for his assistance in encouraging the Mayor to release this information.”
Notes
1. Quick guide to air pollution and the ‘Year of Air’
https://cleanair.london/news/quick-guide-to-air-pollution/
2. Diesel exhaust: The World Health Organisation (WHO) announced on 12 June 2012 it had ‘classified diesel engine exhaust as carcinogenic to humans (Group 1), based on sufficient evidence that exposure is associated with an increased risk for lung cancer’. More details at:
http://www.iarc.fr/en/media-centre/pr/2012/pdfs/pr213_E.pdf
3. Clean Air in London submitted requests for details of emissions of diesel exhaust for every road in London carrying an average of 10,000 vehicles per day or more on: 30 September 2012; 9 November 2012; and 28 February 2013. The Mayor declined these requests. CAL sought an internal review of the third refusal after taking legal advice from Gerry Facenna, a leading barrister at Monckton Chambers. The Mayor responded favourably to this request and released the information on 3 June 2013.
4. ‘Investigation into Government’s failure to control harmful diesel exhaust’ dated 3 April 2013
5. ‘Something in the air’ report by Policy Exchange dated 19 July 2012
6. ‘London has highest levels of NO2 of any capital city in Europe again’ dated 1 June 2013
https://cleanair.london/hot-topics/highest-no2-of-any-capital-city-in-europe-again/
7. Health impacts
Review of evidence of health aspects of air pollution (REVIHAAP)
Air pollution – Bang goes the theory
http://www.youtube.com/watch?v=s3MCYPNZDEE&feature=share&list=FLTvOgL6SoXxnM-rQtsBC71w
Dangerous airborne particles (PM2.5 and PM10)
http://www.epa.gov/air/particlepollution/health.html
Nitrogen dioxide
http://www.epa.gov/airquality/nitrogenoxides/health.html
Benzene
http://www.epa.gov/ttn/atw/hlthef/benzene.html
8. London Air Quality Network monitoring results
| Brompton Road | Marylebone Road | Oxford Street | ||||
| NO2 annual mean (ug/m3) | NO2 hourly exceedances | NO2 annual mean (ug/m3) | NO2 hourly exceedances | NO2 annual mean (ug/m3) | NO2 hourly exceedances | |
| 2013 YTD | 103 | 363 | 77 | 5 | 105 | 310 |
| 2012 | 92 | 500 | 94 | 122 | N/A | N/A |
| 2011* | 81 | 179 | 97 | 217 | N/A | N/A |
| 2010 | N/A | 307 | 98 | 524 | N/A | N/A |
| 2009 | 90 | 371 | 107 | 469 | N/A | N/A |
| 2008 | 95 | 515 | 115 | 801 | N/A | N/A |
* Western extension congestion charging zone removed 4 January 2011
Monitoring sites
Legal limits
http://ec.europa.eu/environment/air/quality/standards.htm
Brompton Road in 2013
Marylebone Road in 2013
Oxford Street in 2013
9. ‘10 steps for Clean Air in London’, a guide for campaigners
https://cleanair.london/solutions/10-steps-for-clean-air-in-london/
10. The innovative new Clean Air in Cities IndexTM (or Birkett IndexTM) reports the health impact on the population of long-term exposure to PM2.5 in local areas,regions and England as a whole.

The Clean Air in Cities IndexTM (or Birkett IndexTM) App can be downloaded from the App Store. It can be found at http://itun.es/i6xj69k or by searching for ‘Clean Air in Cities’ on the App Store.
11. The words Clean Air in LondonTM, Clean Air in Cities IndexTM and Birkett IndexTM along with their associated logos are trademarks or registered trademarks of Clean Air in London, a company limited by guarantee, registered in England and Wales, with company number 7413769.
© Clean Air in London 2013
CAL 242 Top 20 worst NO2 tonnes per km in 2012_Final draft 230613
CAL 242 Top 20 worst PM2.5 tonnes per km in 2012_Final draft 230613
CAL 242 Christian Wolmar blog post 240613
CAl 247 Exhibit 10_Carslaw Defra remote NO2 sensing report_Final 160713
Guardian: London’s most polluted roads mapped. 24 June 2013
http://www.guardian.co.uk/environment/interactive/2013/jun/24/most-polluted-roads-london-exhaust-map
Green Party map of Government monitors versus most polluted roads (NO2)
CAL 242 Green Party_map_no2_hotspots_v2
Green Party map of all most polluted roads (NO2)
CAL 242 Green Party_map_no2_all_v2
NOTE: 10 DETAILED SPREADSHEETS LOADED BELOW. WATCH TWITTER OR FACEBOOK FOR FURTHER NEWS