Health and Environment Committee air quality work programme
Clean Air in London (CAL) congratulates the Health and Environment Committee (Committee) on the publication of ‘Air pollution in London – Issues paper’. The paper provides a clear, concise summary of current air pollution issues in London
CAL is writing now with suggestions for further air pollution work to be done by the Committee, as requested in the ‘Issues paper’. CAL has identified eight key areas where the Committee could make a powerful impact on the understanding of air pollution in London and action to reduce it
Committee urged to investigate: health advice and claims by the Mayor of London that tube dust is ‘safe’ for staff and customers; promises from Transport for London in January 2012 that it would publish “results of [its] routine dust measurements, together with an explanation of what they mean”; and exactly how frequently the Tunnel Cleaning Train, promised for later this year, will clean each section of the underground network
Committee also urged to investigate: Mayor’s lobbying to weaken international air pollution laws; action to protect people from carcinogenic diesel exhaust; compliance with legal deadlines; public understanding; indoor air quality; and conflicts between the Mayor’s climate, energy, health and environmental policies
Dear London Assembly Health and Environment Committee
1. What position is London taking during the 2013 ‘Year of Air’ negotiations?
The outcomes from Europe’s ‘Year of Air’ in 2013 will be critical for air pollution in London and the UK for the next decade and beyond. CAL strongly believes that the ‘Year of Air’ must deliver continuity with existing obligations and the further tightening of health and legal protections.
Cities and Member States can take two approaches if they are struggling to meet air quality objectives. They can implement a package of bold measures to meet air quality standards or lobby to weaken the effect of the standards. Unfortunately, CAL believes the Mayor is using London’s significant weight and lobbying power to take the latter approach during the 2013 negotiations. Needless to say, such an approach undermines the health protections provided by UK and European air quality laws for London’s residents, visitors and workers. The Mayor should be driving down harmful emissions and building public understanding of air pollution not undermining one of the bedrocks of public health legislation.
Scrutiny by the Committee could assess the Mayor’s current negotiating and recommend steps that should be taken to protect Londoners and others. Relevant questions in your issues document here are ‘Should the Committee support the city-regions’ position in lobbying the EC?’ and ‘Does the issue of transboundary pollution make a difference to the steps London should take to reduce its emissions?’ (both on page 16). As you know, the Mayor is refusing to release key information to CAL and others about his communications with other cities and regions.
UK and European air quality standards and legal limits have been set to ensure that all European citizens enjoy a universal minimum standard of air quality. Special pleading by large cities undermines this minimum level of protection (for everyone): people should have the right to live or visit large cities without air pollution causing serious damage to their health.
Transboundary air pollution further demonstrates why air quality objectives must apply equally everywhere. Cities such as London are huge sources of air pollutants; if air quality standards are relaxed for large cities it makes it more difficult for nearby towns and cities to meet their own air quality objectives. ‘Imported’ air pollution should be noted in London’s air quality strategies, but the city should also recognise its status as a major air pollution ‘exporter’ at both the UK and European scale.
CAL understands that ‘Partnership agreements’ have been suggested as a way to ‘finesse’ current and future breaches of nitrogen dioxide (NO2) laws. CAL urges the Committee to consider whether such agreements are appropriate in any circumstances and, if they are, when and how might they be used?
2. What action must be taken to protect the public from diesel exhaust?
CAL gave oral evidence to the Committee last year highlighting the latest advice from the World Health Organisation that diesel exhaust is carcinogenic for humans. We need to know how much diesel exhaust is emitted in what areas of London, how it can be reduced, who is exposed and how can people be protected?
Are nanoparticles used to reduce diesel fuel consumption and does this matter? Why are diesel particulate filters being removed from vehicles and engine control units disconnected and are such vehicles no longer roadworthy and/or insurable?
As you may know, the Mayor has resisted some CAL efforts to obtain detailed information about the quantity of current diesel exhaust emissions in London.
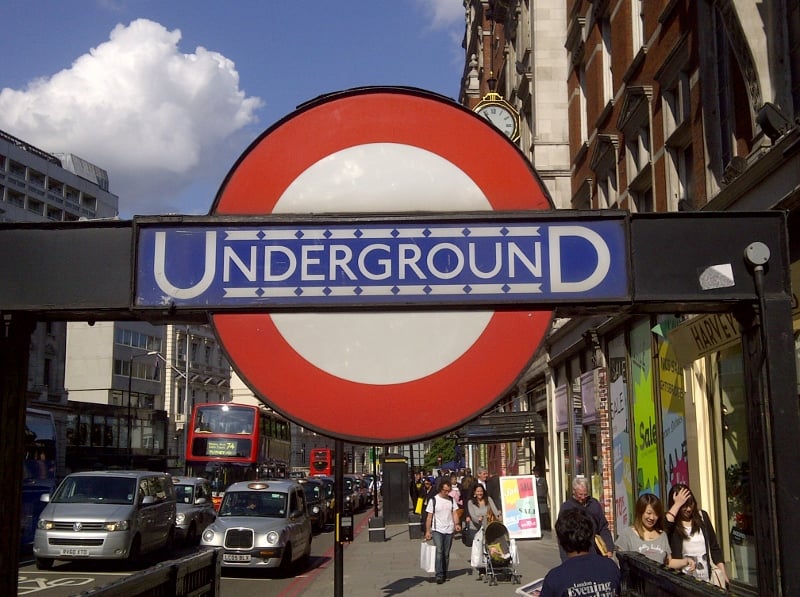
3. How high are levels of air pollution in the London Underground and does it matter?
There is little public information about levels of air pollution in the London Underground or its possible health effects.
In MQT answers, the Mayor has said:
- MQT 3330/2011, 16 November 2011
“As the figures below show, the levels of tunnel dust remain stable compared with those last reported in my answer to question 2546/2011. All readings are less than one third of the Health and Safety Executive limit for general dust, and exposure remains safe for both staff and customers.
Year Dust level in milligrams per metre cubed (mg/m3)
2009/10 0.030 to 1.270
2010/11 0.030 to 1.230
“Dust levels vary by location which is why a range is given.”
- MQT 0282/2012, 25 January 2012
“[London Underground] regularly monitors levels of dust on the Tube within two parameters: air quality experienced by train staff and by station staff. Measurements show that these levels are consistently below the guidance levels recommended by HSE, Institute of Occupational Medicine and the Trade Union Congress.”
In CAL’s opinion, the above statements from the Mayor raise several questions including:
- Why is the Mayor making (and/or relying on?) comparisons between static levels and WELs? As CAL understands it, the monitoring done for Transport for London (TfL) is for static levels of dust which cannot be compared directly with the HSE’s Workplace Exposure Levels (WELs) or the WELs suggested by the Institute of Occupational Medicine. These levels are expressed over a specified period of time (usually eight hours). Has any testing been done across the Tube network over an eight hour or other time period and if so what?
- Why did the Mayor not mention monitored levels around those suggested by IOM and the TUC?:
- the HSE updated its guidance on Workplace Exposure (WEL) limits (EH40/2005 Workplace Exposure limits) on 19 December 2011 for respirable dust and inhalable dust to 4 mg/m3 and 10 mg/m3 respectively;
- the IOM “[suggested] that, until safe limits are put in place, employers should aim to keep exposure to respirable dust below 1 mg/m3 and inhalable dust below 5 mg/m3” (IOM, 5 May 2011); and
- “Because of the serious health risks that exposure to dust can cause the TUC believes that unions and union health and safety representatives should try to ensure that employers follow a precautionary standard of 2.5 mg/m3 for inhalable dust (as opposed to the current 10 mg/m3 standard) and 1 mg/m3 for respirable dust (as opposed to the current 4 mg/m3 standard) for all general dust and dusts where there is not a lower [Workplace Exposure Limits].” (TUC, 1 September 2011)
In other words, the suggestions from IOM and the TUC for respirable dust are one-quarter not one-third of the level recommended by the HSE i.e. illustratively 1.000 mg/m3 compared to 1.230 mg/m3 recorded in static levels.
- Was the Mayor correct to give an absolute assurance that ‘exposure remains safe’ when it is around or near some guideline levels in some locations?
As CAL understands it, scientists have found no safe level for exposure to airborne particulate matter. Indeed, CAL’s understanding is that exposure to ‘dust’ can adversely affect health and it is important to keep dust concentrations as low as possible. In CAL’s opinion, it is wrong therefore for the Mayor to say or imply that such pollution is ‘safe’ when it is around some guideline levels in some locations: it is a bit like saying it’s safe to drive at the speed limit (in some countries).
CAL would like to see this subject investigated by the Committee with a view to establishing inter alia: actual levels of air pollution in the London Underground and trends; a range of expert opinions on possible health impacts from exposure to it; and whether and if so what warnings might be issued to the most vulnerable people. The Committee might also investigate plans to introduce the ‘Tunnel Cleaning Train’ later this year.
4. How will London meet air quality requirements for PM2.5; PM10 and NO2?
CAL supports the suggestion that ‘The Committee could investigate what further measures may be needed to meet PM2.5 limits.’ (page 15). This work could build upon the recently published Air Quality Experts Group report ‘PM2.5 in the UK’ Note 1 and the forthcoming recommendations from the World Health Organisation that CAL understands will be published on 30 January 2013.
CAL suggests that a scrutiny report by the Committee could cover:
- how PM2.5 is monitored in London, and whether Defra is meeting the monitoring requirements of the EU Air Quality Directive;
- the legal requirements of the PM2.5 objectives for both the Mayor and the UK Government;
- trends in PM2.5 concentrations; and
- additional measures needed in order to meet the PM2.5 objectives
Similar investigations are needed for PM10 and NO2. Please also investigate the levels of PM10 around waste and construction sites in London and action needed to reduce them e.g. Neasden Lane in Brent.
5. How can Londoners be empowered to make choices about their own exposure to air pollution?
CAL supports the suggestion that ‘The Committee could review how Londoners can be empowered to make choices about their own exposure to air pollution.’ (page 17). Such a review should focus on the effective use of ‘smog alerts’ and the advice people should be given to help them reduce their exposure to polluted air. As far as CAL is aware, the only smog alert systems for Londoners are the London Air Quality Network and the opt-in airTEXT system.
CAL believes that the Mayor should be doing much more to ensure that warnings of pollution episodes are widely and actively communicated, for example through TV, local newspapers, weather websites and social media. When air pollution is ‘Moderate’ or above vulnerable people should be warned and when it is ‘High’ or ‘Very high’ the general populace should be warned. As CAL understands it, the (otherwise) excellent Met Office and BBC air pollution forecasts do not address urban roadside air pollution i.e. they forecast ‘background’ levels of pollution.
As you know, the Government has not issued a press release warning of smog since April 2011 when it made headline news. The Mayor refuses to issue such warnings saying it is for the Government despite his own estimates showing there have been many hundreds of additional hospital admissions during smog episodes in the last five years alone (MQT 4295/2012, 19 December 2012).
Are people forgetting that one of the biggest issues needing to be addressed is traffic-related air pollution? What action is being taken to protect school children? How is the CityAir programme being rolled out within London?
The Committee should also investigate the steps being taken by the Mayor to ensure the widespread and robust monitoring and reporting of air pollution data.
6. How can public health authorities be persuaded (and supported) to play a leading role in tackling air pollution?
CAL supports the suggestion that ‘The Committee could investigate what support public health authorities need, to play a leading role in tackling air pollution’ (page 18), however the topic needs to be expanded to investigate how public health authorities can be persuaded to adopt the issue of air quality in their assessments and strategies. CAL has been monitoring (and responding to) draft public health strategies in London as they emerge, and so far is aware of only one (the City of London) who has assessed air quality in its Joint Strategic Needs Assessment and prioritised it in its Health and Wellbeing Strategy. Air pollution should also be prioritised by the Mayor’s overarching London Health Improvement Board.
CAL understands that the Department of Health is due to publish additional statistics on local air pollution health impacts during early 2013, which will include the number of attributable deaths and years of life lost for each local authority in England. A Committee investigation could spotlight these statistics, and also help to clarify some of the inaccurate comparisons often made on relative health impacts. For example, the health impacts of air pollution are often compared to cancer deaths, but air pollution is a cause of disease whilst cancer is an outcome. We need clarity on ‘exposures’ and ‘outcomes’ and the impact of non-communicable diseases generally which a Committee report could bring.
7. How can indoor air quality in London be improved?
We spend the majority of our time inside of buildings, and most of our exposure to polluted air comes when we are indoors. Whilst there is a relationship between indoor and outdoor air quality, indoor air quality is also influenced by building design and the presence of mechanical ventilation/ filtration systems. Very little attention has been paid to date on indoor air quality in London, and research by CAL Note3 has revealed that public bodies have a poor understanding of the air filtration systems fitted to their buildings. A Committee report would help to move indoor air quality up the agenda to achieve significant health improvements and energy savings.
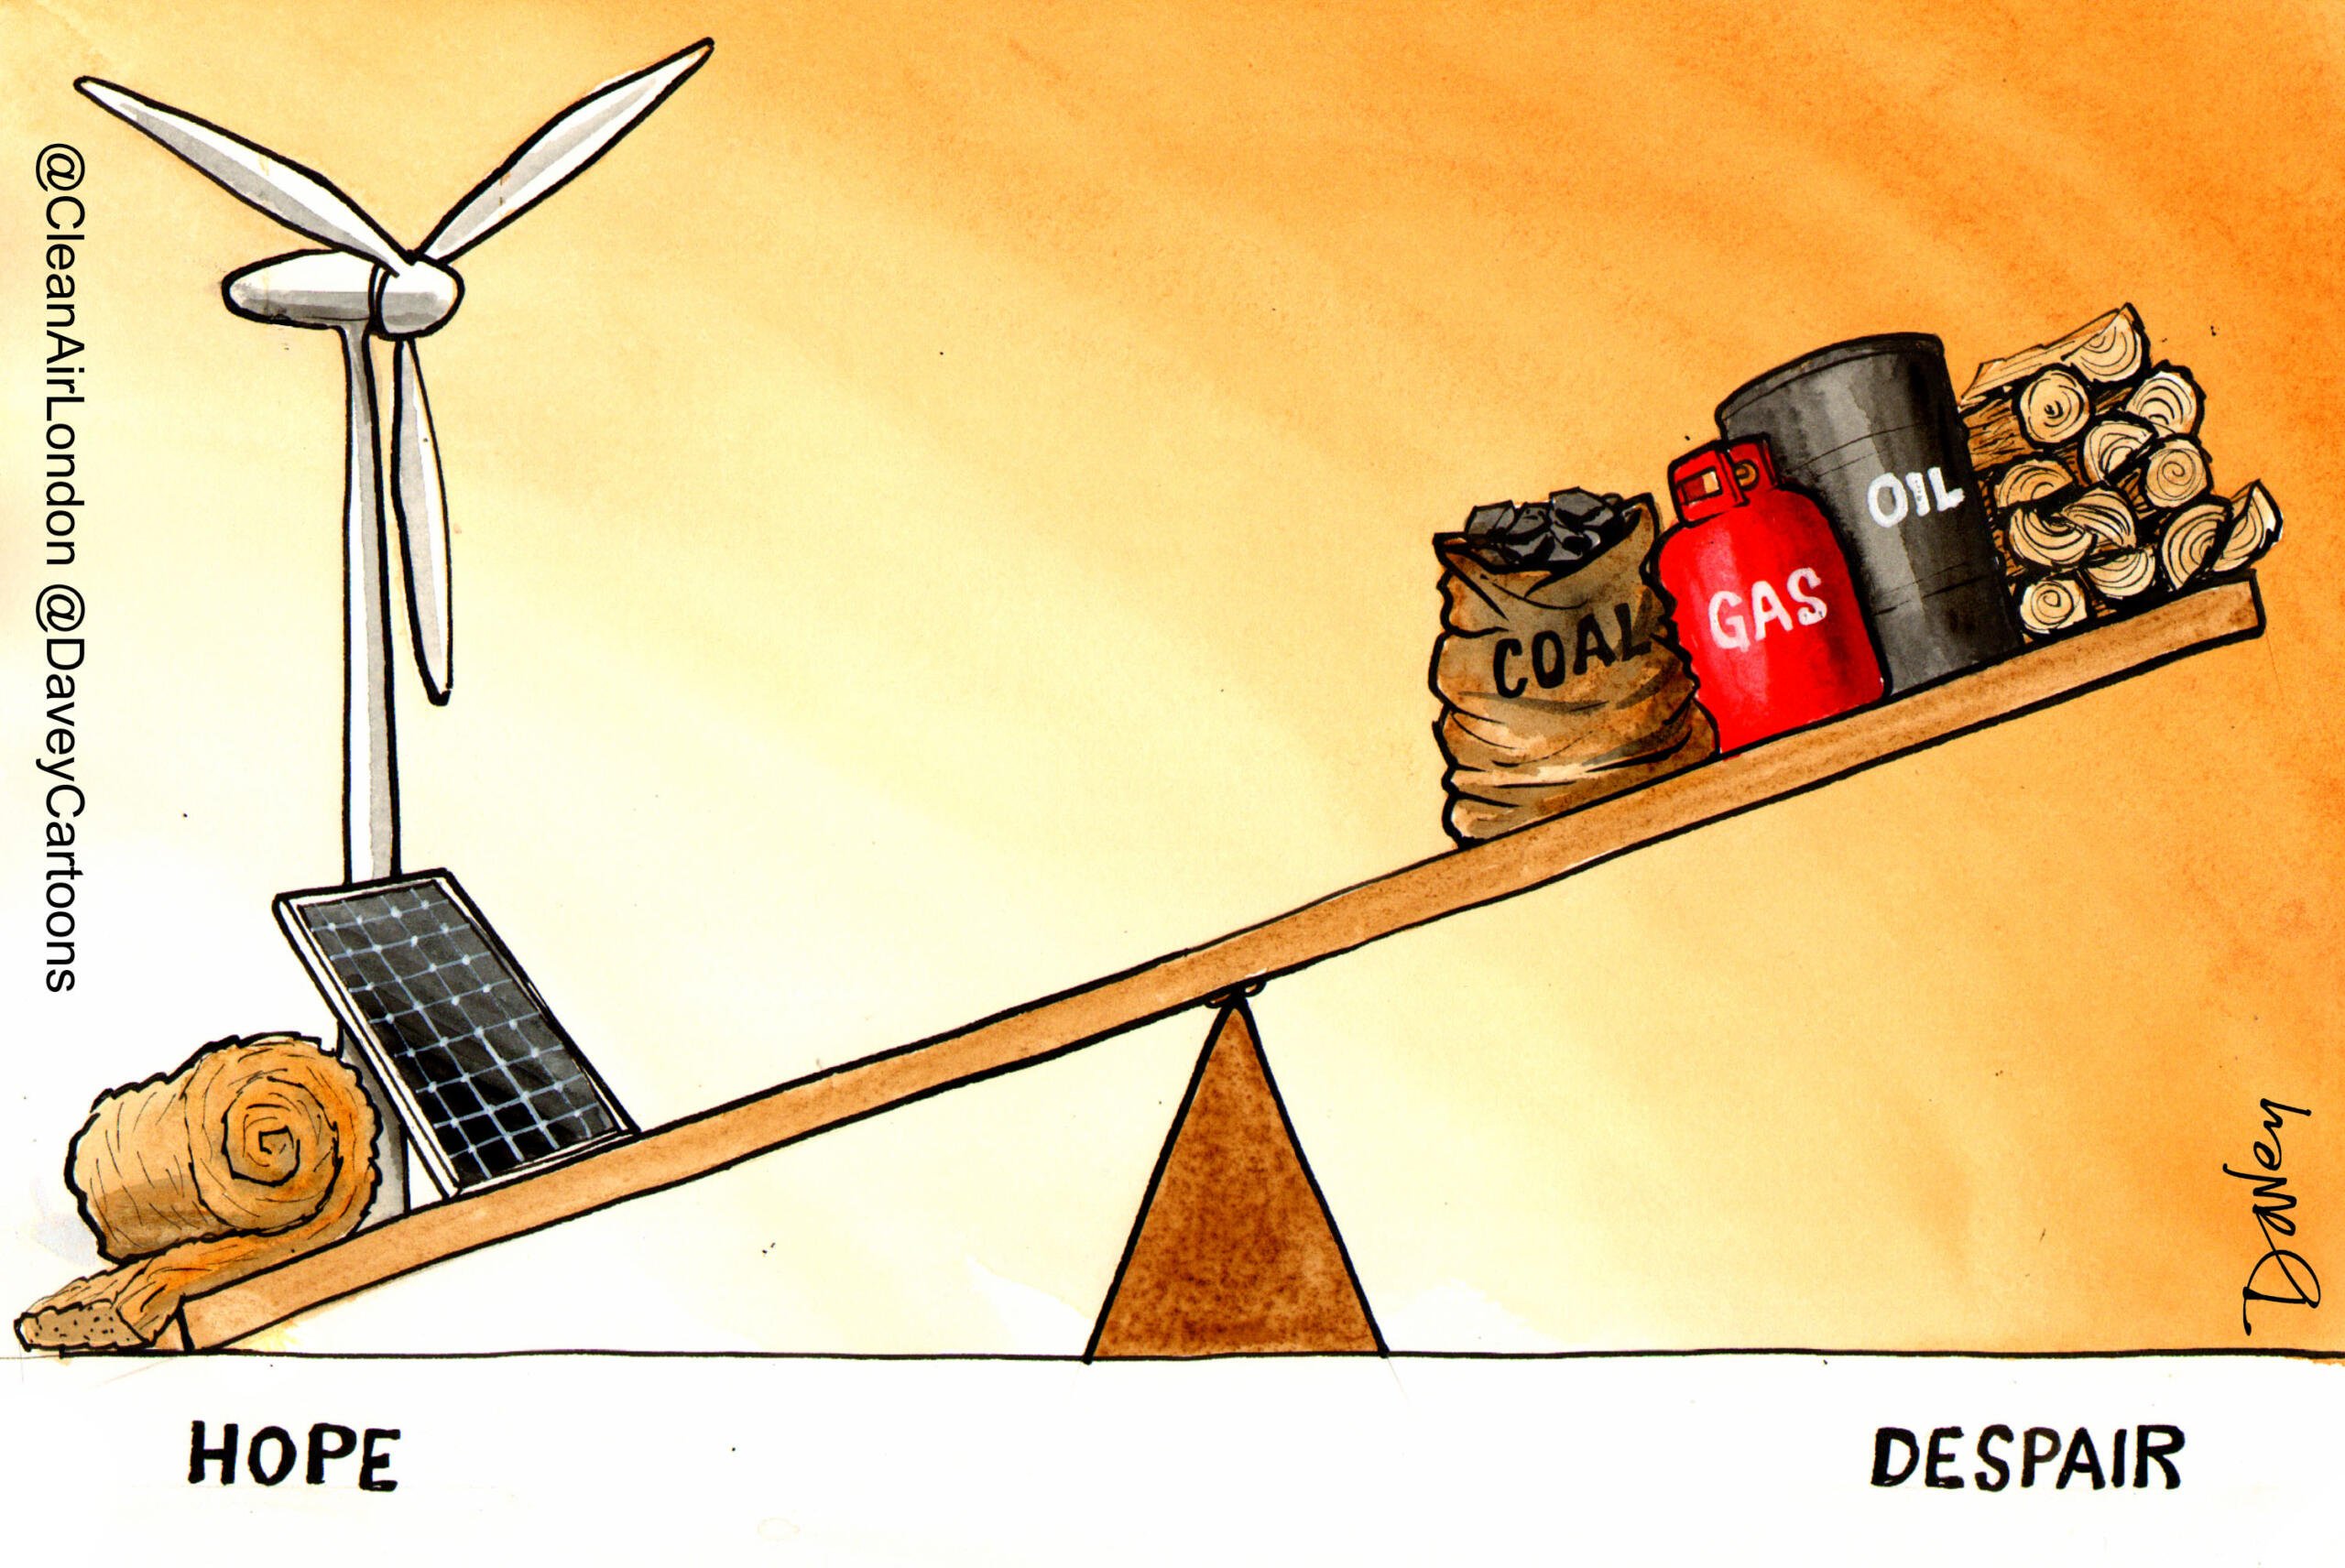
8. How can the Mayor’s air quality and climate change objectives be aligned and co-managed?
The Mayor’s air quality and climate change strategies are distinct, and considerations around co-benefits and trade-offs seem only to be made when the two strategies come into conflict. The Committee could investigate how both sets of objectives can be achieved in a way that maximises co-benefits and minimises trade-offs i.e. prioritising technologies with both air quality and climate change benefits and carefully managing the deployment of low carbon technologies with negative air quality impacts.
Priority issues include:
- Combined Heat and Power (CHP). The Mayor plans to increase hugely the use of gas fired CHP in London. However, modelling suggests this could have very significant negative air quality impacts in central London. More work is needed to understand the technologies used, whether they should deployed in large cities at all and how adverse air quality impacts could be minimised;
- biomass burning in London homes and buildings. Currently, the Mayor seems to be actively encouraging biomass when its use should be discouraged and/or banned. Festival bonfires are also an increasing concern; and
- the use of standby diesel generators. Many buildings in London contain backup diesel generators to ensure electricity supply is maintained in the event of a power cut. Building operators are now being (financially) encouraged to run these generators to provide electricity to the grid in times of high demand Note 2. These generators are likely to have high air pollutant emissions. In CAL’s view, their use should be actively discouraged.
It seems the Mayor’s climate, energy, health and environmental policies are not ‘joined up’ and may be in active conflict with one another.
I hope these suggestions are useful for planning the Committee’s future work on air quality. CAL would be pleased to give further oral or written evidence to the Committee.
Please contact me if you wish to discuss these suggestions or any other air pollution issues.
With best wishes.
Yours sincerely
Simon Birkett
Founder and Director
Notes
- http://www.defra.gov.uk/publications/files/pb13837-aqeg-fine-particle-matter-20121220.pdf
- http://www.flexitricity.com/
- https://cleanair.london/indoor-air-quality/few-local-authorities-know-if-their-schools-use-air-filters-that-protect-children/
- CAL 226 Letter from Peter Hendy 090112_Redacted and reduced file size
- CAL 226 Tunnel cleaning train_FOI EIR July 2012
- CAL 226 Cleared line for TCT briefing_FOI EIR July 2012
Appendix
Extracts from information released under Environmental Information laws and responses from Mayor of London
CAL 226 Tube dust is not safe_Appendix 110213
Letter to Mayor of London dated 18 December 2011
Mayor’s Question Time answers
0282/2012 on 25 Jan 2012
http://mqt.london.gov.uk/mqt/public/question.do?id=39718
3705/2011 on 14 December 2011
http://mqt.london.gov.uk/mqt/public/question.do?id=38964
3330/2011 on 16 Nov 2011
http://mqt.london.gov.uk/mqt/public/question.do?id=38485
3331/2011 on 16 Nov 2011
http://mqt.london.gov.uk/mqt/public/question.do?id=38486
3332/2011 on 16 Nov 2011
http://mqt.london.gov.uk/mqt/public/question.do?id=38487
2546/2011 on 14 Sept 2011
http://mqt.london.gov.uk/mqt/public/question.do?id=37419
2441/2006 on 15 Nov 2006
http://mqt.london.gov.uk/mqt/public/question.do?id=16362
1240/2006 on 21 June 2006
http://mqt.london.gov.uk/mqt/public/question.do?id=14636
1522/2003 on 17 Sept 2003
http://mqt.london.gov.uk/mqt/public/question.do?id=3557
Extracts from eight TfL emails comprising 44 attachments are copied below.
TfL 3
Page 10
to reduce the residual particulate matter content of the tunnel air, thereby improving the environment for both passengers and staff
Page 16
Atmospheric dust levels shall be no worse after cleaning than prior to cleaning. If this is not achievable the Supplier is to specify the time elapsed after completion of a cleaning run when the respirable dust levels will be no worse than before the tunnel cleaning took place. Typical dust composition and combustibility information from recent analysis on the Victoria Line are contained in two 4-Rail reports, see Appendix 1.
Analysis of the respirable dust has revealed that:
• 80% of the dust is made up of iron;
• PM10 size is < 10 μg/m3 with a mean of 7 μg/m3;
• PM2.5 4mg/m3 respirable particles averaged over an 8 hour period.
• Sample measurements indicate that 42.9% of the dust particles (by number) were less than 1 micron in size, with about 41.9% between 1-5 microns, about 11.5% between 5-10 microns and with the remainder (3.7%) being greater than 10 microns in size. Note however that these figures may be skewed by the equipment used to collect the sample.
The Supplier shall confirm the maximum dust and refuse storage capacity of the unit. As a minimum the unit shall be able to store:
• Dust – 10 Tonnes
• Refuse – 4 Tonnes
Page 55
Deep Clean Deep cleaning is defined as the initial cleaning of the Tunnels. The majority of the tunnels have not been cleaned for several years and it is therefore expected that the dust and waste collected will be much greater per kilometre than on subsequent cleaning cycles. It is envisaged that the deep cleaning will be undertaken at very slow speed and require multiple passes over a section of tunnel in order to achieve the standard of cleanliness required.
Routine clean Routine Clean: Once the deep clean has been undertaken, a programme of regular cleaning, at intervals of nominally 12 months will be instigated. “Routine Cleaning” is defined as the cleaning undertaken on a tunnel which has been cleaned by the TCT within the previous 15 months. It is envisaged that routine cleaning will be undertaken at a slightly higher speed than that required for deep cleaning and will require fewer passes (ideally only one pass) over a section of tunnel in order to achieve the standard of cleanliness required.
TfL 4
CAL 209_TfL 4 in 1st_2004-5 R87435
Page 4
The health effects concerning inhalation exposure to dust are dependent upon the size, shape and composition of the particles. In occupational health general dust is classified in terms of particle size, termed either inhalable or respirable. The inhalable fraction of dust is defined as particles that can be inhaled and deposited throughout the respiratory tract, i.e. from the nasal to the alveolar region in the lungs.
Respirable dust is the term given to dust particles that are small enough to penetrate and therefore largely deposit in the alveolar region.
2.2 Respirable and inhalable dusts are currently assessed against the respective Workplace Exposure Limits (WEL’s) of 4 mg/m3 and 10 mg/m3 averaged over an 8-hour reference period (Health and Safety Executive Document EH40/05).
Page 7
Baker Street Station
The results for the monitoring at Baker Street Station are given in Table 9. The monitoring was carried out on the 18th April 2005. The range of the main body of results was 0.05 – 0.43mg/m3.
A single result of 4.78 mg/m3 numerically exceeded the Workplace Exposure Limit of 4mg/m3 (8hr Time Weighted Average) for respirable dust. The monitoring period for this sample was 06.25 to 13.00hrs i.e. a total of 6hrs and 35minutes monitoring.
Therefore, assuming no further exposure before the shift and after, the exposure as an 8hr TWA would be 3.93mg/m3. It was also noted that the rubber boot (Figure 1) on the particular cyclone head was almost completely full of dust. This is a very unusual sampling situation which is not indicative of airborne dust exposure but more representative of dust being directly sucked into the sampling head by accidental contact with a dusty shelf or ledge.
TfL 7
CAL 209_TfL 7 in 2nd_AEN-7000-LUL-REQ-00002 Cut Cover Tunnel Cleaner Requirements
Page 13
Application of water by LFB on the original TCT caused dust to “set like concrete” causing major damage to the equipment.
TfL 9
CAL 209_TfL 9 in 3rd_Analysis of dust from Vic Line
Page 6
Discussion
5.1 Possible routes of exposure to the dust are dermal (skin contact), ingestion and inhalation. The dermal or ingestion routes can be controlled by good hygiene practices and should not be significant for occupants of the train. Dust monitoring carried out on the 09TS had indicated that inhalation could be a possible exposure route for occupants of the train when surface dust is disturbed by air currents from the train in the sidings.
5.2 The results in Table 1 show that approximately 40% of the dust by weight is iron. The presence of iron will be from wear of brakes, track and wheels. This is comparable to the iron level measured in the previous samples submitted from Victoria Station sidings (080672/1 & 080419/1). Iron is likely present in part as iron oxide hence the majority of the dust by weight may be iron oxide. The loss on ignition suggests up to 9.6% by weight could be organic materials part of which may be skin and hair from passengers. Again, this is comparable to the loss on ignition measured from samples 080672/1 & 080419/1. The scanning electron microscopy elemental X ray analysis showed the other major components to be carbon, calcium, silicon and sulphur. The proportions of elements detected were similar to those found in the samples taken from Victoria Line sidings (080672/1 & 080419/1). All of these elements are likely derived from soil and cementitious building materials.
5.3 To allow an assessment of potential exposure to be undertaken the Workplace Exposure Limits given in HSE Document EH40/2005 were considered.
The following are compounds and substances in EH40 representative of cementitious building materials: aluminium oxide, calcium carbonate, Portland cement, magnesium oxide, plaster of Paris and gypsum. These have 8hour time weighted average exposure limits of 4 and 10mg/m3 for respirable and total inhalable dust respectively.
The limits of 4 and 10mg/m3 are generally taken as those applicable to ‘nuisance dusts’ in a workplace setting.
The particle size analysis indicated that a large proportion of the dust would be classed as respirable, in that it is able to travel deep into the lungs. It was also noted that the smaller particles observed were mainly iron whereas the larger particles had greater amounts of silicon and calcium.
The Workplace Exposure Limits given in the table overleaf are for compounds and groups of compounds that were identified in the analysis. It should be noted that some materials do not have limits set in EH40
Page 8
Conclusions and Recommendations
6.1 Most of the parameters measured in the sample from the Victoria line were found at comparable levels to those previously found in the sample taken from Victoria Station sidings.
6.2 The majority of the particles in the dust were found to be below 10μm in diameter and therefore respirable.
6.3 No asbestos fibres were detected in the dust.
6.4 Analysis of the dust indicated the major component by weight to be iron, likely derived from the brakes and wear of the wheel rail interface. The other major components were carbon, oxygen, calcium, silicon and sulphur. These are likely derived from soils and cementitious building materials.
6.5 As previously for the sample taken at Victoria Station sidings (080672/1), an evaluation of the components found (compared against the Workplace Exposure Limits in EH40/2005) suggested that the limits for ‘nuisance dust’ should apply. That is 4mg/m3 for respirable dust and 10mg/m3 for total inhalable dust. However, because the particle size analysis found the majority of particles to be less than 10μm the limit of 4mg/m3 should be considered.
Page 9
The presence of total petroleum hydrocarbons in the sample at levels of greater than 0.1%wt warrants the classification of Hazardous Waste should disposal of bulk quantities of the dust be required. This is because all petroleum oils carry the risk phrase of Category 2 Carcinogen unless proven or refined so as not to contain benzo(a)pyrene. Also, if the material from this location is to be land-filled, it is no longer acceptable to be mixed with other waste and must be analysed further as per the Waste Acceptance Criteria regulations to determine if and how it can be landfilled.
TfL 16
CAL 209_TfL 16 in 4th_Combustibility of dust from Vic Line_DUPLICATED
Page 5
Conclusions
4.1 The dust sample 090115/080709/1 that had been collected from the Victoria Line by the client was found to be non explosible and could not be ignited. An exothermic reaction was seen during the layer ignition test but not such that the sample freely burnt.
4.2 A sample of dust collected in 2003/4 (034381/6) from the Victoria Line between Green Park and Oxford Circus was qualitatively more combustible, smouldering freely when ignited. There was insufficient remaining of this archive sample for extensive testing.
Page 6
Qualitative observations show that depending on the makeup of the dust greater or lesser combustibility may be obtained. Settled dust containing higher levels of skin flakes, oils, fluff fibres would be more combustible, whereas dust from construction works containing higher levels of cementitious materials would be less combustible.
TfL 17
CAL 209_TfL 17 in 4th_FW Freedom of information request re dust and gas levels
Page 1
dust is not likely to cause significant harm to our staff or customers
TfL 25
CAL 209_TfL 25 in 5th_IDR OIL R8 (2)-Concept Design Review
Page 29
Maintenance workshop 11. “OPEN POINT: LU still have to determine the best method for disposal of dust and waste from the TCU. The maintainers request that they come into contact with the smallest amounts of dust possible. LU HF are responsible for the end users activities once the waste is removed from the TCU. SK are only responsible for the end user tasks associated with the TCU itself and therefore the following, which were noted during the meeting for further consideration by LU, are outside SK’s scope of work:” – this contradicts contract clauses 8.2.3, 8.2.6 and 8.2.7. LU have taken lead in this area to allow SK to focus on the machine but SK cannot ignore it entirely.
TfL 28
CAL 209_TfL 28 in 6th_S Stock exhaust fans dust report
Page 18
According to the ISO/CEN respirable dust convention (published in the UK as part of BS CEN 481:1993), any particle with an aerodynamic diameter of less than 10 μm is termed ‘respirable’, i.e. capable of penetrating deep into the lungs. Particles larger than 10 μm but smaller than 25 μm are termed the thoracic fraction, i.e. they may enter the chest/lung area, but tend not to collect deep in the lungs. Particles of all sizes and larger than 25 μm (typically up to 100 μm are termed ‘inhalable’. According to the HSE EH40/2005 Workplace Exposure Limits, the mass concentrations of inhalable and respirable dust particles should not exceed 10 mg/m3 and 4mg/m3 respectively averaged over an 8 hour work shift.
12.12 The indications are that only in the worst combination of possible circumstances would the levels of inhalable and respirable dust rise to levels near the workplace exposure limits defined in the HSE guidelines. To get an idea of the maximum possible increase in dust levels, the same calculation performed in section 11.5 can be made using the highest dust level recorded (18 mg/m3 at Great Portland Street), a Grimm correction factor of 5 and a platform volume of 2080 m3. In the case of a train moving slowly, this gives a total airborne dust concentration of 4.3 mg/m3 which is considered to be an extreme case and very unlikely to ever occur.
However, there is fairly compelling evidence that dust levels at Baker Street, Great Portland Street, Euston Square, King’s Cross and Aldgate stations could rise to ‘nuisance’ levels of 1 – 2 mg/m3, where a slight hazy effect might be seen or which might cause quicker than usual build-up of dust on surfaces.
The HSE limits apply to an 8 hour exposure period, i.e. in the event that levels at the limit or even somewhat higher occurred, they would be unlikely to pose a health risk to train passengers, though contractors or station staff exposed for longer periods on a regular basis could be at risk.
12.13 Dust levels generated at Liverpool Street station were lower than at the stations mentioned in 12.12, but the ballast here appeared more greasy on the surface. The effect of this would be to lessen the amount of dust that could become airborne due to its ‘stickiness’. However, dust was certainly generated and combined with the low ceilings and small volume (compared to some other stations) and no open air sections nearby, it is probable that nuisance dust would be generated within the station under ideal conditions.
Station sizes and air currents vary widely and there are too many variables involved to incorporate every possible effect. The results therefore do not purport to predict precise dust levels, but generally indicate that dust will be raised to levels above current ones and there is therefore a potential risk.
12.14 For tunnel or covered areas of track, there is no risk of visible dust being raised, even when trains are stopped at signals. Respirable dust levels in localised areas of tunnels could be similar to those in station areas, but the time of potential exposure to these levels would be short, and is not considered to be a risk to passengers or train staff.
12.15 The results of SEM and EDX analysis of the dust collected in the vacuum bags and from the ballast samples taken show chemical elements typical of tunnel dust. In most cases the majority of the samples were found to be composed of ferrous debris and iron oxides. Other materials identified were general sands, clays and cementitious building material.
Levels of sulphur (which in conjunction with calcium is usually indicative of gypsum) in the ballast sample dust were higher than in the vacuum bag dust. This is because the ballast samples would have included material taken from at least four to five ballast layer stones deep, where remaining gypsum and other building material dust has probably remained after previous works. No asbestos was detected in samples from the ballast.
Page 19
Conclusions
13.1 The amount of airborne dust generated during the initial surveys of the Metropolitan Line track led to an over-estimate of the level of visible dust likely to be raised during the main testing phase.
13.2 The reported airspeed from the S Stock train brake fan exhaust was found to be fairly accurate.
Airspeed at a distance of 600 mm from the exhaust (ballast level) was found to be less than 2 m/s.
13.3 Airspeeds from the HVAC unit could not be verified, but simulation of the exhaust vent using the reported airspeeds showed that little dust disturbance could be expected at a distance of 1.5 m away.
13.4 Due to the low ballast level and HVAC airspeeds, the new S Stock trains are very unlikely to generate clouds of visible dust or sand during running along the Metropolitan Line track in either stations or tunnels.
13.5 Exact levels of dust will only be known when the new trains are run on the Metropolitan Line track. However, the tests carried out have indicated a range of expected dust levels and have shown that changes in station dust levels are likely to occur after the introduction of S Stock trains.
13.6 The testing procedure carried out has shown that most dust disturbed from the ballast in all cases is likely to be in the 0 – 0.65 μm size range. SEM scans showed high iron composition in the dust. A Grimm correction factor of at least 2.5 should be applied to particle masses.
13.7 For the particular site positions tested, the largest increases in airborne particle masses were at Baker Street, Great Portland Street, Euston Square and Aldgate stations. High particle numbers were also seen at Kings Cross station.
13.8 The worst case scenario is thought to be the case of a slow moving train entering or leaving a station where the moving brake fans are directed at most of the length of the track. In a station with a smaller enclosed volume there is potential for airborne respirable dust levels in the range of 1 – 2mg/m3 to be generated. Stations with low enclosed volumes are at King’s Cross, Great Portland Street, Euston Square and Liverpool Street
13.9 Under certain conditions, ‘nuisance’ dust levels of 1 – 2 mg/m3 could result in a slight ‘haze’ being visible when viewed along a platform long.
13.10 The health risk to passengers is thought to be minimal since dust levels are very unlikely to exceed HSE guidelines (4 mg/m3 respirable over 8 hours). However, there is a slight risk to station staff and contractors that would be exposed for a longer period.
13.11 Dust levels estimated in this investigation should be added to current levels to obtain an indication of dust levels in a station during running of S Stock trains. It remains unclear whether increases in dust levels would tend to lower again over time.
13.12 More dust was generated during tests carried out in the cess than in 6 foot areas since the cess collects more dust and is not partially protected from airflows by the position of a traction current rail (in stations).
Page 20
It was visually assessed that the brake fan airflow would not easily disturb dust lying lower than about two ballast stone layers deep. However, dust on cable runs under the platform recess in stations would significantly add to dust generated from the ballast.
13.14 Tests in covered sections away from stations have shown that airborne dust will be generated in these areas, but the risk to passengers and staff is low due to the likely short exposure times.
13.15 Open areas of track pose very little airborne dust risk, since there is less dust on/in the ballast and what dust there is would not be confined, i.e. it would be relatively easily dispersed. This also applies to Barbican Station, and parts of Farringdon and Baker Street Stations.
13.16 The samples collected in the vacuum bags were found to be composed of elements typical of tunnel dust, mainly iron oxide/ferrous debris, silica (quartz), clays and cementitious building materials.
13.17 No asbestos was detected in any of the dust or ballast samples taken. Several ballast samples however contained levels of contaminants that would (for the purposes of disposal) class them as Hazardous (see 4RS-CSI-090149-R211504).
14 Recommendations
14.1 Cable runs within station areas and possibly in tunnel sections up to 50 meters away from stations should be cleared of all visible dust.
14.2 Platform recesses in covered stations should be cleared of visible loose sandy material or suitably covered with new ballast.
14.3 Initially, it should not be necessary to clean dust from track ballast in covered sections. This may be reassessed after introduction of S Stock trains on the line.
14.4 The possibility of removing dust from track ballast in the cess and 6 foot areas of covered stations should be further investigated. Sites with highest potential risk are King’s Cross, Great Portland Street and Euston Square Stations.
14.5 A suggestion to remove dust in ballast would be to develop a machine (or modify an existing one) using a similar concept to the test rig built for this investigation, i.e. blow air into an enclosure to get dust airborne and then vacuum that air through a filter to remove the dust.
14.6 At a later stage, cleaning track ballast in the cess and 6 foot areas at Baker Street, Farringdon, Moorgate, Liverpool Street and Aldgate Stations should be considered. Dust levels at Barbican station are not thought to present a risk.
14.7 Current dust levels at all stations should be measured during traffic hours for later comparison to levels that could be measured after ballast cleaning and after introduction of the new trains.
14.8 The recommendations in report 4RS-CSI-090149-R211504 should be referenced when dealing with track ballast and dust collected at certain locations (particularly Aldgate, Euston Square and Liverpool Street Stations).
Pages 22 to 45
Photos and graphs
TfL 32
CAL 209_TfL 32 in 7th_TCT – Overview Compatibility Mode
Summary presentation with photos and diagrams….
TfL 41
CAL 209_TfL 41 in 8th_Tunnel cleaning Train briefing
Briefing note
TfL 42
CAL 209_TfL 42 in 8th_VLU-PVEC3017-BCV-BUC-00001_-_TCT_Replacement_Business_Case
Page 3
Executive Summary
The Replacement Tunnel Cleaning Train (TCT) project includes the design, development, testing and commissioning of a new tunnel cleaning train for operation on all LU lines (except W&C due to access). The vehicle will be operated, maintained by Transplant under agreed terms & conditions.
Substantial cost benefits are expected. This is supported by past experience on LU and direct experience from other analogous metro system operators. All world class metro systems utilise some form of mechanised cleaning system, and the common experience is that this is beneficial. Indeed, New York and Beijing have recently placed large orders for new vehicles.
Further to the fiscal benefits owing to less reliance on (largely ineffectual) manual cleaning activities, operational benefits are expected in the form of reduced HSE incidents such as track fires and injuries and improved asset reliability. The project will positively impact LU reputation and eliminate the public perception that the tube is polluted and is an unhealthy environment.
Page 4
Tunnel dust and dirt affects the performance of the LU fleet and provides a poor environment for passengers and our staff. It also has the potential to cause fire and smoke incidents.
Page 5
Worldwide Experience
A UITP Study on “Cleaning of Underground Railway Tunnels in the Extended Track Vicinity” was published in 2006 and summarises the findings of a questionnaire circulated to 17 worldwide underground railway operators (11 from Europe, 3 from Asia and 3 from America). The railways range in scale and complexity, age, vehicle type and power supply. They range from as little as a few kilometres to the largest of 431km and were constructed between 1860 and 2004. The following summarises the key findings that are likely to pertain to LU. (Contact the Sponsor for access to the complete report).
Cleaning of the tunnel and track facilities was for all Metros an important factor in being able to ensure safe and reliable operation. It also influenced customer satisfaction.
In most Metros, there were found to be niches, opening, galleries and spaces of different size and configuration, much like the LU network.
Ballastless permanent way predominated, but ballasted track was very common.
Damage cause by dirty tunnels was widespread; there were some 510 fires in the previous 5 years and problems due to dirt had been encountered on equipment including signals and points. Train delays and cancellations were also noted impacts.
Cleaning regimes varied considerably from daily litter picking to monthly cycles. Track adjacent to platforms was generally cleaned on a 2-3 weekly cycle. Over ground track was generally cleaned between 4-6 months. Tunnels were generally cleaned on a monthly basis.
Page 6
f) All Metros use some form of mechanical aid – tongs, non-track guided vehicles, vacuum cleaners and cleaning trains were common items of equipment. All but one Metro supplemented mechanised cleaning with some level of manual cleaning
g) 11 of the 17 Metros use some form of tunnel cleaning train. 8 metros use bespoke cleaning trains, 1 uses a standard vacuum cleaning train, whilst the remaining 2 use vacuum equipment on specially modified legacy trains. All cleaning trains are operable in both directions. The remaining six metros use rail-guided or non-guided vacuum cleaners.
h) Cleaning is generally undertaken during nightly shut-downs, but in some cases during normal working hours. Cleaning speeds vary between 1km/h to 20km/h, with a maximum line speed of 65km/h.
i) Waste mainly comprised of paper, tin cans, bottles, small waste (cigarette butts) and dust. Dust contributed between 6 – 76% of total waste. Dust is removed as part of vacuum or washing activities within the context of regular track cleaning.
The decision to purchase a tunnel cleaning train was not entirely dependant upon economic viability, but rather on the case of a fundamental decision (strategic imperative) or government requirement. However, where economic considerations were taken into account, they were often justified after purchase and use of the vehicle.
In summary, the study concluded that those using mechanical cleaning vehicles assessed their operation as positive. In all but one case, the vehicles did not completely eliminate manual cleaning.
Project Objectives
The primary project objectives (identified at the outset of project definition) are covered in the Project Requirements and are replicated below:
Design, build and commission a replacement tunnel cleaning train which is capable of cleaning deep tube tunnels and sub-surface line to the standard and frequency required.
The intention will be to undertake an initial deep clean of all SSL and BCV track and tunnels within one year of commissioning and JNP within 3 years and then subject all lines to a regular cleaning programme (3-4 times per annum). The minutes of the first Access/Logistics Workshop are held by the project team.
The vehicle will be capable of cleaning up to 360º in deep tube, and penetrating deep into the ballast, neither of which can currently be achieved with manual cleaning.
Options Examined
The original Tunnel Cleaning Train Replacement Strategy drafted in 2007 was never formally issued due to difficulties in getting adequate involvement and information from Tube Lines on the potential benefits the vehicle would offer their operation. However, based upon BCV and SSL assumed benefits a number of options were put forward and assessed. These are provided in Appendix A. At that time the solution proposed was:
Page 7
“The considered option of the Plant Strategy Group is that the preferred option would be to work with a supplier … to develop a dedicated TCT that could cover all Lines on the Underground network. Whilst all parties agree that there are a number of failure modes that can be attributed to the build-up of tunnel dust these alone are insufficient to generate a business case which meets the Internal rate of return required by the private investment rules of the Infracos. There are however a number of un-quantifiable benefits to health and safety we need to be taken into account. As a result the proposal from the Plant Strategy Group is that LU should fund the initial capital investment as “Strategic Plant” given that they can probably borrow the initial capital cost at a lower rate of return, and the Infracos would then purchase a minimum number of shifts per year”.
Recommended Option
Option 1 (the preferred option) is to proceed with the detailed design, development, testing and commissioning of a tunnel cleaning train replacement. The supplier shall provide the tunnel cleaning unit (TCU), whilst the motive and power units (MPU) will be provided by LU via conversion of legacy fleets. This permits the supplier to focus on the cleaning aspects of the project. LU will retain systems integration responsibility which is perceived to be a high risk for the supplier and therefore costly. Maintaining the legacy motive and power units will become more difficult over time, but LU has the domain skills and competencies to ensure safe and reliable operation.
Alternate Options
The Base Option (Do Nothing) continues with current manual cleaning activities and falls short of the standard. Staff will continue to be susceptible to health and safety risks (eg slips/trips/falls and asbestos containing materials). There will be no reduction in track fires or improvement in asset performance and assets will be subject to long term performance issues as a result of tunnel dust/debris, imposing a high future maintenance/operating cost.
Option 2 is to proceed with the detailed design, development, testing and commissioning of a tunnel cleaning train replacement. The motive and power interface will provided by the supplier in a single train consist. This exposes LU to high risk due to potential non-delivery of an approved/ compliant solution, adds significant costs (eg EMC), but eliminates the need to convert legacy vehicles. Project timescales will be longer owing to the approvals process and the benefits are as per those in Option 1.
Page 11
Health & Safety
Airborne dust levels in the LU network has been a subject of debate, media attention and medical articles (such as Seaton et al, 2005). The underground is an engineering environment and generation of airborne contamination cannot be avoided. However modern rolling stock relies less on friction braking than ever before, so brake block dust is lower than it has ever been. Also management approach to the wheel rail interface is improving so the generation of iron based contaminates should also be expected to decline. At present most scientists currently agree that the air quality on the LU network does not pose a significant short-term or long term risk to workers or commuters. This in part is due to the fact that the concentrations of ultra-fine particles are lower than those above ground in central London and in part due to the composition of tunnel dust. Tunnel dust is coarser, consisting largely of iron oxides with concentrations well below that of allowable workplace limits for welding fume (also iron oxide), which has been identified as the most suitable dust to compare tunnel dust with, from the occupational exposure point of view*. Nevertheless, it is preferable to reduce the levels of dust where possible. The public perception of risk is such that an active programme to reduce dust levels is advisable.
*Seaton, A., Cherrie, J., Dennekamp, M., Donaldson, K., Hurley, J.F., Tran, C.L. (2005) The London Underground: dust and hazards to health. Occupational and Environmental Medicine 62, 355-362
Note: It should be noted that European Directives 1999/30/EC and 96/62/EC set maximum allowable levels of airborne particulates in ambient air (meaning outdoor air in the troposphere, excluding work places) and therefore do not apply to the underground environment.
Passenger perception of LU network cleanliness impacts LU reputation. The network is ‘dirty’ in the majority of locations, particularly in the deep tube and above the cable runs where existing manual cleaning activities do not venture (compare the appearance of the Jubilee Line following the JLE to any existing line and the contrast is considerable). Any pollution on publicly visible surfaces (such as walls opposite platforms) and the haze sometimes seen on platforms contributes to public perception that the tube is polluted and is an unhealthy environment. This perspective will be perpetuated in the media despite medical conclusions that currently show otherwise (but may change in the future). Consequently, potential commuters may actively decide to avoid the tube in preference for other modes of transport (walking, bus), resulting in loss of revenue.
Reduction in LTI risk exposure associated with cleaning activities. There is no data demonstrating the number of LTIs directly associated with manual cleaning activities. However, slips/trips/falls are an inherent risk that is proportionate to the number of manhours spent in the tunnel environment. If the manual cleaning arrangements can be rationalised, then there will be a net reduction in LU risk exposure and LTIs
Page 18
Summary of media articles
Page 19
Appendix B
In a parallel universe, employees work for a leading firm who aspire to be world class. These employees work in an office in a major capital city and have regular visits from their large number of clients. They have access to all the modern conveniences that one would expect and generally provide a good service. The exception is that one day they stop cleaning their office. Rubbish bins are no longer emptied, floors are not vacuumed and spillages are left on the carpet. Before long the rubbish, dirt and debris begins to pile up to unacceptable levels, but the firm chooses to do nothing about it – it can’t make a financial case to remove the rubbish.
But over time the managers recognise that the organisation is not quite as good as it use to be. Morale is low – no one wants to work in a dirty office – and the many clients who visit the firm begin to question the ability of the firm – after all, if they can’t keep their office tidy, then can they actually manage their business? The health of employees is adversely affected and a greater risk of risk of fire and slips/trips/falls exists. Absenteeism rises and the efficiency and effectiveness of the firms operation is adversely impacted. Over time, this becomes the norm as everyone accepts that the office will never be cleaned.
One day the firm decides to renovate its office to provide greater capacity for its clients. Enhancements begin, but the office was not cleaned and consequently dust is thrown everywhere – it gets into computers, copiers, printers (and importantly the coffee machine). Soon these devices begin to experience a higher level of failures than existed previously. The new facilities were expected to be world class, but they are not even ‘world average’. Everyone realises that rubbish and dirt is causing problems. Although the economics don’t stack up, the firm recognises the need to clean the office – health, safety, reliability, morale & pride, client perception, etc. Each of the arguments is real but difficult to measure. But in totality they form a compelling argument for cleaning the office, which is clearly “the right thing to do”.
…End of document…
TfL 43
CAL 209_TfL 43 in 8th_AW filter test
Air filters tests May 2012
TfL 44
CAL 209_TfL 44 in 8th_Messprotokoll_120419_Filtertest_TÜV
Air filter test in German???